Last week I wrote about a recent report from the Democrats on the Joint Economic Committee called “Retirement Security in Peril.” In my post, I narrowed in on some flaws in how the report talked about teacher pension plans. But after thinking about it a bit more, I wanted to zoom out and focus on some of the broader trends. I'm going to show four graphs to help illustrate exactly why the "retirement security crisis" put forward by the Democrats is almost exactly wrong.
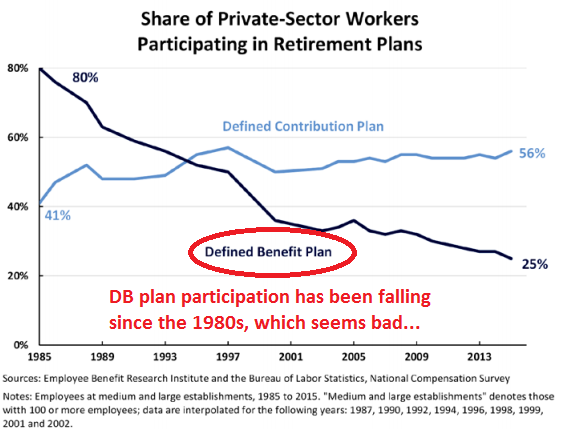
First, the graph below shows the declining share of private-sector workers who have access to a defined benefit plan. This graph comes straight from the congressional report, and I've added some crude red markings to emphasize just how dramatic this change has been. In the Democrats' telling, defined benefit plans offer workers greater retirement security, and so the decline in DB plans must also mean a decline in retirement security. This fundamental narrative is wrong--retirement plan coverage does not equal retirement benefits for workers--and as a result it's also a misread of what's happened over this time period.
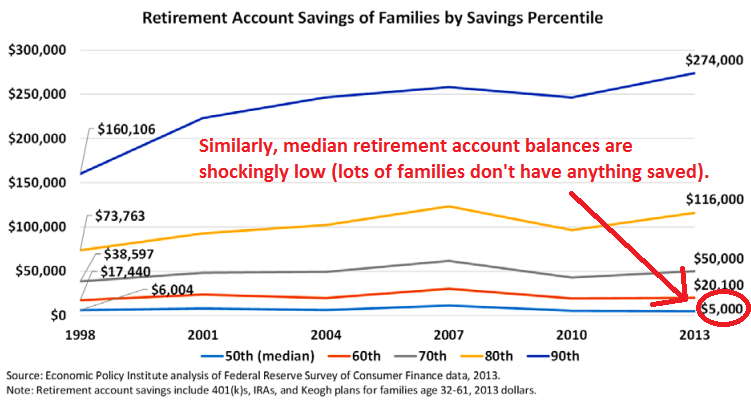
The next graph again comes straight out of the Democrats' report. They lead with the startling finding that the median retirement savings account balance in 2013 was only $5,000 (!). That's the median, and it means most American families have nothing saved for retirement at all.
That sounds really bad, and it is. But take another look at how the median has changed over time. On an inflation-adjusted basis, it dropped from $6,004 in 1998 to $5,000 in 2013. Although it's not pictured here, the same data source found that the percentage of families with retirement accounts inched up from 2013 to 2016, as did the median account balance of those plans. Regardless, it's hard to look at this graph and see any sort of golden age of retirement savings for American families. While things may not look great today, they never were. In fact, as I'll show in the next few graphs, things may actually be improving.
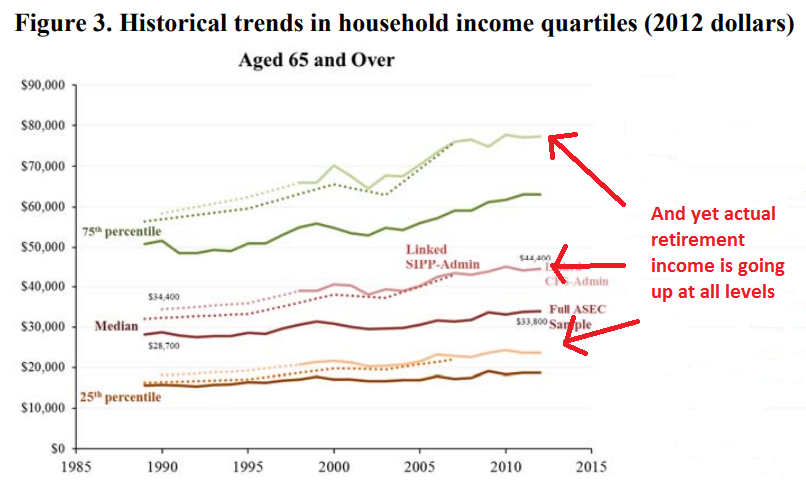
To focus more on outcomes, take a look the graph below from a recent report from the U.S. Census Bureau called "Do Older Americans Have More Income Than We Think?" This graph has a lot going on, but essentially the authors were looking at two sets of data. One, represented by the dark, solid lines, shows survey data, whereas the dotted and lighter-colored lines represent the authors' more complete portrait of income using administrative and tax data. On an inflation-adjusted basis, Americans aged 65 and older, of all income levels, have more retirement income than they did in the past. That trend shows up when you ask Americans in a survey, and it shows even up more when you check administrative and tax records.
These positive outcomes are occurring at the same time as fewer and fewer Americans receive defined benefit pensions. While the decline of DB pension plans certainly didn't cause these improvements, it's notable that the American retirement landscape is improving despite the changes going on across the country.
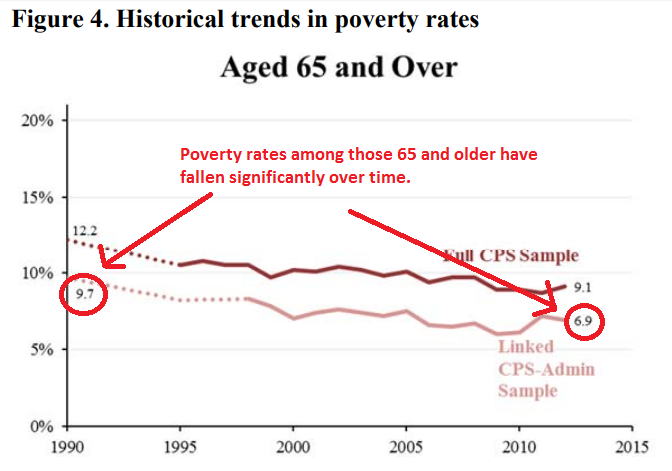
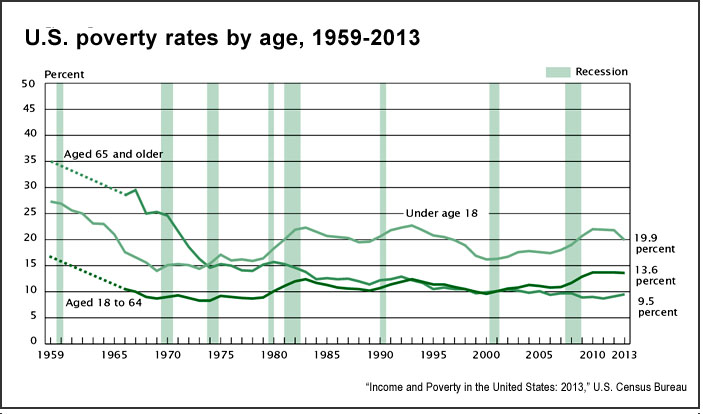
In the graphs above, there are some clear trends that retirement income is increasing faster for wealthier Americans than it is for those on the lower end. But that's likely a result of increasing income inequality, and we should be careful not to equate "inequality is increasing" with "low-income individuals are worse off." In fact, consider the next graph, again from the Census report. It shows that poverty rates among those 65 and over have fallen significantly over time.* Again, the survey data (represented by the top, darker line) is under-reporting the good news that shows up when the authors looked at actual income collected in administrative data (represented by the bottom, lighter-colored line).
In other words, the decline in defined benefit plans has not led to a decline in retirement security. If anything, the retirement landscape has actually improved a bit over time. It's theoretically possible that it's still too soon and the next generation of retirees will suffer from this change, but by now we should have seen that start showing up in the national data, and we haven't. In fact, the trends look pretty similar even if you look at recent retirees versus those who retired 10 or 20 years ago. The "Retirement Security Crisis" has been right around the corner for the last few decades, and yet it hasn't arrived.
*Meanwhile, child povery rates have barely budged over this same period of time, and the poverty rates of working-age adults (ages 18-64) are actually up a bit.
Taxonomy:Earlier this month the Democrats on the Joint Economic Committee issued a report called “Retirement Security in Peril.” While they get some facts right, they also miss the forest for the trees. Worse, the story they tell about the retirement security offered to our nation’s public school teachers is dangerously wrong. Instead of praising those plans, congressional Democrats should be doing more to protect this large and important group of workers.
First, it’s true that many American workers lack any retirement savings at all, and there’s been a shift in the private sector away from defined benefit plans to defined contribution plans. This shift has put more of a burden on workers to save on their own, rather than relying on their employer.
But contrary to the narrative put forward in the report, these shifts haven’t harmed our collective retirement prospects. If the congressional Democrats had read a recent report put out by the U.S. Census Bureau, they’d recognize that our reduction in old-age poverty is one of our greatest accomplishments over the last few generations. Through safety net programs like Social Security and Medicare, as well as private savings that have proven surprisingly resilient, we’ve significantly reduced poverty rates among the elderly. Contrary to the “peril” described in the Democrats’ report, elderly Americans are less likely to be poor than any other age group.
Democrats should be playing the role as vigilant watchguards of this progress, but that will require them to diagnose our true challenges more accurately. For example, rather than generic calls for “expanding” Social Security, we should be talking about how to make the Social Security formula more progressive to better cover low-income Americans with spotty work records and limited access to retirement savings plans.
Moreover, the report’s descriptions about teacher pension plans are wildly out of touch with reality and attempt to paper over real problems in the public sector. Here’s what they write:
Teacher pension plans are an example of the key role that defined benefit plans play in providing families a stable retirement. Teacher pensions, much like other defined benefit plans, provide a more secure path to retirement, helping many teachers overcome the multitude of obstacles that prevent saving for retirement. More than 75 percent of teachers participate in defined benefit plan. These pension plans reward longevity with an employer, creating economic incentives for high-quality teachers to stay in the profession. These plans serve as effective recruitment and retention tools for schools, helping attract and maintain the best teachers to ensure student success. Pension plans also afford teachers a more predictable source of income into retirement, which is particularly important for low- and middle-income teachers.
This is little more than teachers’ union talking points, and it ignores a large and growing body of work about the problems with teacher pension plans. Here’s the truth:
- Teacher pension plans do work well for certain groups of teachers who stay in the profession for their entire career. But that’s only a small fraction of the workforce. Depending on the state, two-thirds to three-quarters of teachers don’t stay long enough to benefit from the pension system. Congressional Democrats should care about these people.
- Teacher pensions reward longevity within a state (not any particular employer), but the rewards are so difficult to understand and occur so late in a teacher’s career that few teachers react to them. When we looked at early-career teachers, we found that teachers will not put in even a single extra year to qualify for a pension benefit. A study looking at a costly pension enhancement in St. Louis found it only affected the behavior of a very small group of teachers who were right on the cusp of retirement. Another study out of Oregon also failed to find any effect.
- Unlike in the private sector, where Congress has taken steps to improve the benefits offered to workers and the funding stability of their retirement plans, public-sector plans lack those same basic protections, and the plans have adopted unnecessarily risky actuarial assumptions. For example, 15 states require teachers to serve for 10 years before qualifying for retirement benefits, which would be illegal in the private sector. Virtually every state-run teacher pension plan would fail the financial rules that Congress put in place to protect workers in private-sector plans.
- States have managed their teacher pension plans so poorly that they’re now under-funded by $500 billion. Due to rising costs, states have dramatically cut retirement benefits for new workers, and states and districts have been forced to scale back their spending on instructional costs, including on teacher salaries.
- Forty percent of public school teachers do not participate in Social Security, but they should be. Back in the 1990s, Congress attempted to ensure that non-participating workers had benefits that were at least as generous as Social Security, but the implementation of that rule has been botched by the IRS, leaving too many workers unprotected from years of low retirement saving.
I could go on. But rather than holding up teacher pensions as a space worthy of emulation, Congress should be holding hearings on some of these issues.
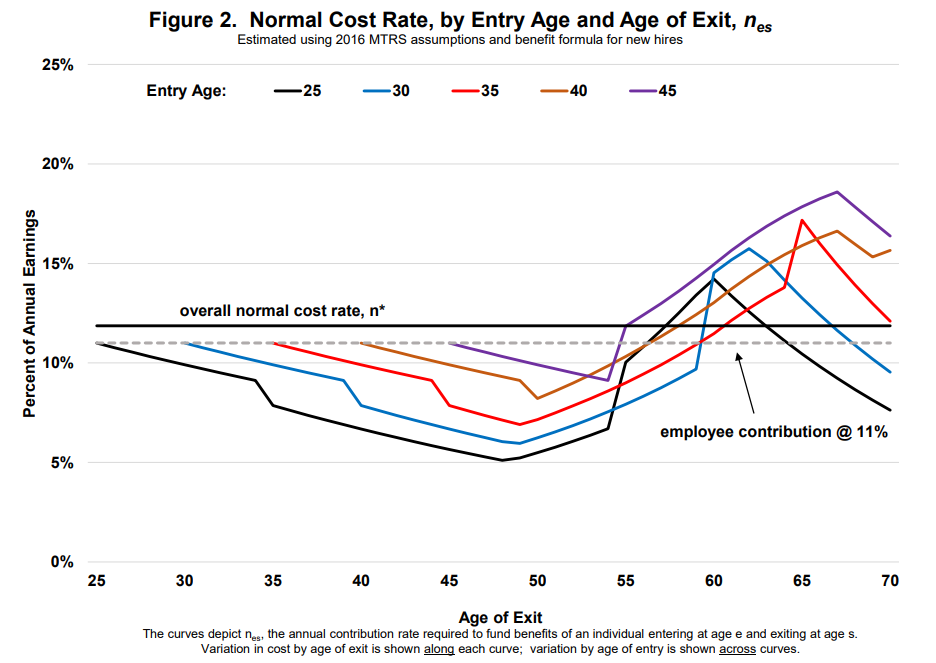
Taxonomy:The benefit structure of pension systems is weird. The benefit an educator gets out of a pension fund is actually not a function of how much they contributed and the state contributed on their behalf. Instead, it is based on a number of factors, including: the age they enter and exit the system, their years of service, and their salary. That’s not how other retirement plans work. A defined contribution plan such as a 401k, produces benefits that are based on employee and employer contributions, plus whatever interest is earned on those contributions. Money out is a product of money in.
As we’ve written on this blog previously, pension benefits are decoupled from contribution rates. As such, they can hide large cross-subsidies that typically transfer retirement wealth to the most veteran educators. In a new study of the Massachusetts Teachers’ Retirement System (MTRS), Robert Costrell and Dillon Fuchsman from the University of Arkansas find that 74 percent of educators are pension “losers.”
In addition to the heavy back-loading of state pension systems, cross-subsidization is a big reason for so many educators earning benefits that are less valuable than their own contributions. What happens is that states’ report a uniform contribution rate, say 15 percent, with 5 percent coming from employees and 10 from employers. But no individual gets that 15 percent. Instead, the money is pooled together and awarded out via formula, and actual distributions can vary widely vary from individual to individual. And that variation tends to follow a few patterns that disadvantage newer entrants into the education profession and which favor long-term veterans.
Costrell and Fuchsman find that, in contrast to the statewide uniform rate, some individuals will qualify for benefits worth 5 percent of their salary, while others will qualify for benefits worth 20 percent of their salary. They estimate that roughly one in four Massachusetts educators will be pension winners and receive benefits of greater value than the uniform statewide rate; the rest do not.
In fact, a large group of Massachusetts teachers will receive pension benefits worth less than even their own contributions. How long that is the case depends on their age when they entered the profession. As shown in the graph below*, a 25-year-old entrant won’t qualify for benefits worth more than her own contributions unless she stays more than 30 years (the black line in the graph). Older entrants (purple line) become pension winners much more quickly and are more likely to receive retirement subsidies from younger and newer teachers.
There are a number of reforms – ranging from relatively low-effort to completely reforming their teacher retirement systems – that states should consider. For one, they should increase transparency around contribution rates and the actual cost of benefits for individual educators. It is a problem that some teachers think they’re getting 15 percent of their salary toward retirement when in fact it is closer to 5 percent. But even that change won’t address the problem of massive unfunded liabilities that drive up the cost of pensions for educators and states. To tackle that, states should consider giving new educators the option of a cash-balance plan, or a defined-contribution plan that would, for the majority of new educators, actually provide a more valuable retirement benefit.
*Source on the graph: Robert Costrell and Dillon Fuchsman, “Distribution of Teacher Pension Benefits in Massachusetts: An Idiosyncratic System of Cross-Subsidies,” University of Arkansas, Draft, February 2018, available at: http://www.uaedreform.org/downloads/2018/02/distribution-of-teacher-pension-benefits-in-massachusetts-an-idiosyncratic-system-of-cross-subsidies.pdf.
Taxonomy:Desperate times call for desperate measures, or so the saying goes. Staring down a financial crisis, Illinois is considering a fiscal Hail Mary: a massive fire sale on public debt. On Tuesday, the State Universities Annuitants Association (SUAA) proposed to the Illinois legislature a plan to fund the state’s pension system by selling a 27-year, $107 billion bond. In essence, the state would be betting they could earn more from the stock market over this period than they would pay toward the bond. While Illinois’s finances certainly are in real trouble, issuing the largest public bond in history may do more harm than good.
There are a number of reasons that selling a pension obligation bond (POB), particularly one of this size, is a perilous path for Illinois.
1. It’s a gamble that state investments earn large returns. In the past, states that made this bet have often lost. For the POB to work out in the state’s favor, the portion of the bond the state invests must generate greater returns than the interest on the original bond owed to investors. This strategy could pay out, but it also could not. Remember, consistently over-estimating returns is part of the reason pension funds like Illinois’ accrued so much debt in the first place.
2. Timing matters. The moment when a stressed pension plan needs to acquire additional funds to meet its obligations is not necessarily the best time to invest in the market. The $10 billion POB Illinois issued in 2003 performed well until the market crashed in 2008. Without a significant return, a pension obligation bond can end up actually increasing debt obligations. With the stock market currently at or near all-time highs, now may not be the best time to make this sort of gamble.
3. Beggars can’t be choosers. Illinois’s finances are in shambles. The state is in desperate need of resources to meet its pension obligations and it is constitutionally prohibited from saving money by slashing benefits. The state also has a record of political turmoil and financial strife. Investors know this. It is likely, then, that potential investors will demand a sizeable premium to purchase the state’s bonds. This will further squeeze the gap between the returns Illinois earn and what it pays on the bond. In short, it’s a seller’s market, and Illinois is in a poor position to negotiate favorable terms.
4. A debt swap still leaves debt. Issuing a $107 billion POB doesn’t really change Illinois’ financial woes; it simply moves it around. The state will still carry $130 billion in pension-related debts. One issue with this strategy is that the debt tied to the POB is more rigid, and cannot be kicked down the road as states so often do with their pension obligations. Unlike the pension debt, the bond would force the state must make regular payments to creditors or risk legal action.
5.The pension system will continue to accrue debt. Perhaps the most significant failing of this strategy is that it will do nothing to slow down the rapid pace at which Illinois is adding to its pension debts. Taking out a loan to pay down current obligations – even if successful – won’t stop new debts from piling up. This strategy, indeed any approach to help Illinois deal with its burgeoning pension debts should be paired with broader retirement reforms.
Given these serious concerns, issuing over $100 billion in public bonds likely is not the most prudent course for Illinois. That said, the magnitude of Illinois pension debts is such that doing nothing is not really an option. As we’ve written elsewhere, there are other strategies that states facing untenable unfunded pension liabilities can take. For example, the state could offer a pension buyout to reduce long term costs. States could also – and probably should – seek out new revenues. While I understand the urge to swing for the fences and to try and address their fiscal problems all at once, Illinois should instead seek out gradual and sustained reforms both to fund their existing pension liabilities, and to restructure their public retirement system. The state is in a deep fiscal hole, and part of getting out is to stop digging.
No one disputes the question of whether today's teacher pension plans are expensive to operate; they are. Many people assume that an "expensive" retirement plans must obviously translate into generous benefits for workers, but that's not always true.
If an employer contributes more money to a 401k plan, that money goes directly into workers' accounts. But that's not how most teacher retirement plans work. Under the defined benefit pension plans that cover 90 percent of public school teachers, benefits are delivered through formulas tied to the worker's years of experience and salary. Actuaries make some assumptions about how much those benefits will be worth in the future and how much is needed to save today in order to pay for those benfits, and then employers contribute the amount that's needed. That's the theory, at least, but in practice, states have accumulated $500 billion in unfunded teacher pension benefits, and so the contributions made into teacher pension plans have become more and more divorced from the actual benefits delivered to teachers.
Just how divorced have contributions and benefits become in teacher pension plans? A lot! Consider the following graphs.* The first graph below shows total retirement contributions into teacher pension plans, as a percentage of teacher salaries, by state. It includes the teacher's own contributions, plus the contributions made on her behalf from her district and state (which I group together as the "employer" contribution). As the graph shows, total contributions are quite high. The horizontal red lines are pegged to experts' recommendations that workers save at least 10-15 percent of their income (in addition to Social Security). Teachers in 46 states are meeting the minimum suggested threshold, and teachers in 37 states are meeting the higher savings threshold.

This is how most people see teacher pension plans, because they equate "teacher pension contributions" with "teacher retirement benefits."
But this story is incomplete. Pension plans today are expensive, but the bulk of the costs are going to pay down unfunded liabilities, not for actual benefits for teachers. Once we take out the debt costs that states and districts are paying, the total retirement savings start to look worse. The next graph is the same as the first, but this time I've stripped out the contributions used to pay for debt. All that's left is the contributions going toward actual teacher benefits.
As before, the horizontal red lines represent the suggested contribution rates for workers to earn adequate retirement security. Looked at this way, teachers in 25 states meet the minimum threshold, but in only five states do they meet the higher target.

Now, I'll pause here to note another trend. In the private sector, all employees are automatically enrolled in Social Security, but in the public sector that's been left as a choice to the states. Notice that almost all of the states meeting the savings targets are enrolling their teachers in Social Security. Nationally, there are about 1.2 million teachers who lack Social Security coverage, and this graph helps illustrate that Social Security provides a steady, guaranteed base of benefits that states struggle to provide on their own.
There's one more wrinkle to this discussion, which is the distribution of contributions between workers and their employers. So far, I've included all contributions from any source, but what if we limit it to employers only? State legislatures set the contribution rates for both teachers and employers, and the average state is forcing teachers to contribute about 7.8 percent of their salary toward retirement. This is perhaps a good thing--workers should save for retirement, and they wouldn't all do it on their own--but it's also relevant to know how much teachers today are being asked to pay for their own benefits.
The graph below looks only at the employer's share of retirement benefits. Here, I've tweaked the red lines representing the savings targets to assume that teachers and employers should evenly split retirement contributions. As the graph shows, states by and large are not holding up their end of the bargain. Only 15 states are meeting the lower-end threshold, and only seven are meeting the higher target. To put it another way, most teachers are getting less from their employer than if they worked for a private-sector company where workers got Social Security and a 5 percent match on 401k contributions.

Now, some people might quibble with savings thresholds I've used, or note the findings presented here hinge on states' own investment assumptions--if we assume that states are not likely to hit their aggressive investment targets, their guaranteed benefits start to look more generous. Those are both fair critiques. But it's also worth noting that what I've used here are averages across all employees in a given state. Some workers will earn benefits that much higher than the statewide averages, while most teachers will get even less.
Regardless, if states were to adopt more conservative investment targets, their liabilities would also increase, and contributions would also have to rise, and the divide between contributions and benefits would only increase. Even under current assumptions, there's no disputing that teacher pension plans are expensive, and the majority of today's teachers are not receiving the benefits of those contributions.
*Note: The data for these graphs comes from the National Council on Teacher Quality.
This afternoon, I spotted a tweet from a San Diego parent:
There's something particularly wrenching about being asked what services should be cut at your kid's school to pay for increased employee pension & healthcare costs, when most working parents don't have pensions. https://t.co/Vs6uMojuSt cc @sdschools
— Ashley Lewis (@AshleyJPL) January 12, 2018I followed the link to the survey, and a message from the San Diego Unified School District said it was seeking input on how to resolve a growing budget shortfall due to "increases in costs outside of the district’s immediate control, such as healthcare costs, utilities expenses, and state retirement contributions that are all expected to rise for the foreseeable future."
In the pension world we call this "crowd out." Benefit costs are slowly crowding out the discretionary money available for states, districts, and schools to spend on other priorities. San Diego is now seeking input on what to prioritize in its cuts. Here's it's proposed list:
- Reduce centrally funded professional development opportunities not related to mandated activities. ($1-$5M) Explanation: If a professional development service is legally required, it would not be reduced.
- Reduce substitute and hourly costs by optimizing staff schedules, training, and professional development. ($1-$500k) For example, reducing professional development offered during school hours when substitutes may be required.
- Reduce some central office funded positions from 12-month to 11-month and/or 11-month to 10-month. ($1-$500K)
- Reduce custodial services. ($1-$7M)
- Reduce landscape services to schools. ($1-$500k)
- Reduce non-mandated health services in areas where alternative services can be provided. ($1-$9m)
- Reduce centralized support of parent education and outreach. ($1-$2M)
- Reduce/eliminate non-mandated transportation. ($1-$2M) Example: If a child is transported as part of their special education services or other federal mandates, their service would be maintained.
- Realign school bell schedules to maximize efficiencies within transportation. ($1-$250k)
- Reduce central support of career technical education programs. ($1-$1M)
- Reduce school police support services to schools, classrooms, staff, and the community. ($1-$1M)
- Reduce non-mandated mental health services in areas where alternative services can be provided to students. ($1-$4M)
- Reduce support for non-mandated services within special education programs. ($1-$5M)
- Reduce central office IT support to services to schools, classrooms, staff, and the community. ($1-$200k)
- Reduce/eliminate early childhood education (preschool) in areas where alternative services can be provided to students. ($1-$8M)
- Reduce or eliminate music and art in schools. ($1-$4.5M)
- Reduce library hours or close libraries. ($0-$1M)
- Reduce centrally funded counseling services. ($1-$2M)
We've written before about how this is a national trend, how rising pension costs are only just beginning to hit California schools, and how these trends are projected to affect Los Angeles. Our sober policy analyses have attemped to raise the alarm about how rising pension costs are affecting teachers and students, but perhaps nothing presents it in starker fashion than seeing the potential cuts to school district services. Unless policymakers act, these sorts of difficult discussions are likely to play out all over the country.
Taxonomy: