
For an organization that claims to care about workers, the Economic Policy Institute (EPI) is awfully dismissive* of how teacher retirement policies play out for individual teachers.
In a new report for EPI, Monique Morrissey asserts that, “teachers and schools are well served by teacher pensions,” and attacks our work looking at how many teachers benefit from today’s teacher retirement plans.
The debate centers on one critical question: Should we care about individual workers’ lived experiences in a given profession, or should we take a snapshot of the current workforce as representative of all those who experience it? How you think about that question will inform how you think about how well most teacher pension systems work today.
Morrissey wants us to consider a snapshot, or cross section, of the active teaching workforce. Today’s teachers have a range of ages and experience levels. Some are just entering the profession, while others are closing in on retirement. It’s hard to capture that diversity and Morrissey attempts to take this cross-sectional approach and answer the question of how many teachers will reach the 30-year mark. In her estimation, 80 percent of today’s teachers will do so.
But here’s the problem with that method: a snapshot of today’s teachers omits anyone who once was a teacher and is no longer. For every teacher who’s closing in on 30 years of experience today, there were many others who started out at the same time who are no longer part of the picture today. We know this because state pension systems maintain good data on participants and what they are owed. For instance, about one-third of new, young teachers in North Dakota will make it to 30 years, compared to only about one-in-ten teachers in North Carolina.
A snapshot, then, is irrelevant to determine what percentage of all teachers will receive adequate retirement benefits, because employees accumulate retirement savings as individuals. It’s also a misleading way to analyze the data. Under defined benefit pension plans, like the ones serving most public-school teachers, teachers receive retirement benefits according to their own salary and their own years of experience. If they serve only a short period of time, they don’t get much in the way of retirement benefits. Moreover, pension plans don’t deliver benefits in a linear fashion, and they provide disproportionately large benefits to teachers who stay for a full career.
We don’t have to speculate about this or come up with hypotheticals; every state posts their data on pension plan websites.
That’s why our work on teacher retirement looks at the chances any particular teacher has of reaching various retirement milestones. And again, our figures are not derived from speculative models, we use data from the state pension plans themselves, which use the same data in their own financial calculations.
Pension plans have to estimate how many teachers will reach various stages of their career and, in turn, qualify for pension benefits. Every pension plan publishes these assumptions in their financial reports, and they conduct regular “experience studies” to see if their assumptions are correct or if they need adjustments. (Perversely, state policymakers use this data to make pension plans even harder to qualify for in order to shore up their flagging finances, for instance in 15 states it takes ten years to vest for even a minimal teacher pension; that’s a problem for workers that EPI quickly glides over).
Since Morrissey relies heavily on a prior research paper on California (which I’ve written about before), I'll use an example of California’s most recent experience study, adopted in 2017. The graph below shows the pension plan’s estimate for voluntary (“withdrawal”) by the teacher’s year of experience. This graph is for females, but the state has separate, albeit similar, assumptions for males and for other sources of turnover, like retirement, death, or disability.
In the graph, the skinny blue line was California’s prior assumption, and the bars represent the actual experience from 2016 and 2011, respectively. Based on its observations, the state is slightly tweaking its assumptions going forward, to the orange line.
Again, every state needs these assumptions to be accurate, or else it could risk over- or under-saving for future pension payments. After running their experience studies, states publish their final assumptions in tables like the one below. The way to read the table is that, for any female member in her first year of service, California expects 15 percent to leave and 85 percent to stay. Out of the remaining 85, California assumes another 9 percent will leave in year two, another 7 percent in year 3, and so on.
What we’ve done in our work is to look at a typical teacher starting out in a state and ask, if we follow the state turnover assumptions, what are a teacher’s chances of reaching the state’s vesting requirement, when she’ll first qualify for any benefit? And, what are her chances of reaching the state’s normal retirement age?
We believe those are the right questions to ask. They’re the questions any given teacher should ask in planning for his or her own retirement, and they’re the questions the pension plans are asking themselves.
The answers to those questions show that pension plans are not working well for large majorities of people who enter the teaching profession. In the median state, about half of all new teachers won’t stay long enough to receive any pension at all, and only about one-in-six will stay for a full career. That’s not a typo. That’s how few teachers make it.
No one is in dispute of these estimates. They look slightly different for men or for people who begin teaching at various ages, but in reality the main driver of teacher turnover, at least early in his or her career, is years of experience, not age or gender. (For simplicity’s sake, we typically only report the survival rates for new, 25-year-old females, but a more sophisticated study by Bob Costrell and Josh McGee found similarly depressing results even when looking at teachers who enter at all different ages.)
EPI doesn’t try to challenge these numbers either—on page 5 of her report, Morrissey concedes “the critics’ calculations may be accurate,” but then she tries to change the conversation to the snapshot approach. That’s a fundamentally flawed way to look at retirement security, because it discards large numbers of former teachers and ignores the basic facts about how individual teachers accrue benefits over time.
Reasonable people can disagree about what to do about this problem. Some advocate 401(k) style approaches while others favor traditional pensions but with some tweaks. And there are hybrid options like “cash balance” plans that have aspects of both of those approaches. The reality is that there are trade-offs with every approach and it’s possible to design lousy pensions and good 401(k)s and vice versa. What we shouldn’t disagree about, however, is that this conversation is too important not to be informed by the best data and honest straightforward analysis of what it means and what those trade-offs and choices are.
*Note: This piece is mainly about EPI’s methodology, but their report also includes a number of alarming statements about teachers. For example, at one point they admit that “vesting requirements are primarily cost-saving, not retention, devices,” essentially waving away the fact that half of all new teachers won’t stay long enough to vest and sticking a knife in literally millions of American workers. Moreover, this statement concedes the point Kelly Robson and I made in a recent article for Education Next that showed that pensions are not a retention incentive for the vast majority of teachers.
WalletHub recently released its new rankings of the best states for teachers. This year, there is a new best and worst state. New York grades as the best state overall, while Arizona came in last.
WalletHub graded states based on their opportunity and completion, which included salaries, pensions, growth, and even tenure. They then also took into account the state’s academic and work environment, which among other things, was based on student-teacher ratios, turnover, and union strength. Altogether, this ranking is based on a breadth of variables.
WalletHub made at least one key improvement from its rankings last year: They amended how they evaluate teacher pensions. Previously, they rated states solely on the average pension paid out to retirees. As I wrote last year, it is a big problem to evaluate a state pension system this way, because average pensions don’t tell the whole story of a state’s pension system. Less than half of teachers even qualify for a pension. Take New York, WalletHub’s highest rated state. It has an average pension of around $44,000 but only 40 percent of teachers stay long enough to qualify for one in the first place.
To their credit, WalletHub responded to this criticism and upgraded how they assess the quality of state pensions. They now also include the percent of teachers whose pension doesn’t break even. In other words, teachers whose pension benefits are less valuable than their own contributions to the pension fund. This is a good decision by WalletHub that improves how they evaluate teacher pensions across the country.
We have our own 50-state ranking of state pension systems. Check out how your state measures up.
Taxonomy:A new report from the National Public Pension Coalition (NPPC) reminded me of Upton Sinclair's famous line, "It is difficult to get a man to understand something, when his salary depends upon his not understanding it." The NPPC is an advocacy group funded by pension plans, so it makes sense that they cannot fathom any reasons why traditional defined benefit pension plans might not be great for all workers. In their new report, they try to argue that traditional defined benefit pension plans are better for charter school teachers than 401k-style plans, but in the process they make some glaringly misleading assumptions.
First, the report compares apples and oranges. Instead of comparing options that cost the same amount, the report ignores any notion of cost. If two retirement plans take the same contributions and make the same investments, they’ll get the same return. There's no magic sauce of pension plans, but the NPPC report tries to bury that fact by using wildly different contribution rates, and then assuming a much lower rate of return in defined contribution plans, despite recent data suggesting essentially no difference across different types of plans.
Now, NPPC would have been on firmer ground if they acknowledged that some charter school retirement plans are cheaper than the ones run by states. That's not universally true, of course, but it would be a fair statement, and one that leads to a debate about what our priorities are and the right balance between upfront salary versus in-kind benefit costs. There are also a range of diferent retirement plans, and each has trade-offs. Instead, the NPPC implies that traditional defined benefit pension plans are always the best retirement plan, which is objectively false for large groups of workers, including many charter school teachers.
Worse, NPPC is stuck on the theory of pensions rather than trying to understand what happens in reality. Their comparison point in the defined benefit pension system is someone who teaches for 35 consecutive years (!). We’ve run the numbers on this using each state’s own actuarial assumptions, and here’s how many teachers reach 35 years in the eight states NPCC studies:
California: 31 percent
Florida: 9 percent
Indiana: 7 percent
Louisiana: 2 percent
Michigan: 8 percent
North Carolina: 0.4 percent
Pennsylvania: 0.5 percent
Wisconsin: 16 percent
California is an outlier on the high end, where about one-third of teachers reach NPPC’s 35-year mark. But in most states, NPPC is making its statement about all workers based on a tiny fraction of teachers.
The giveaway in NPPC’s report is that they don’t show how benefits accumulate over time. Instead, they only show comparisons in this very extreme case. But as we’ve shown in state after state after state, the vast majority of teachers leave before they ever get close to the large back-end benefits highlighted by NPPC. This is the reality of today’s teacher pension plans, and it leaves ALL teachers worse off, no matter where they work.
It would be more intellectually honest if NPPC tried defend this position. If they came right out and said the only thing that mattered to them was providing high back-end benefits to a small fraction of the teacher workforce, we could have a reasonable discussion about whether the trade-offs are worth it. Given who pays for the NPPC’s work, they may be willfully blind to those trade-offs, but it leaves them making silly arguments in an effort to distract the conversation.
About 2.7 million workers—1.8 percent of all Americans—are covered under one of two federal retirement programs, and earlier this fall the Congressional Budget Office (CBO) released a report reflecting on changing benefit systems and considering further changes to those plans. The report has some useful parallels to the retirement plans offered to teachers; here are two main takeaways:
1. Pension reform can lower costs without significantly harming retention.
From 1920 through 1983, federal workers were enrolled only in a defined benefit pension plan. It was generous for full-career workers, but less so for short- and medium-term workers, and at the time federal workers did not have access to the portablee, progressive benefits offered by the Social Security program.
Starting in 1983, though, Congress cut the defined benefit component essentially in half, added a 401k-like defined contribution element, and began enrolling all new workers in Social Security. The CBO found that this three-legged approach provides much more portable benefits to workers with similar replacement rates in retirement, at a much lower and more predictable cost to the government. Although the CBO does see evidence that the switch lowered retention rates somewhat, the effects were small, much smaller than a subsequent retention boost observed after pay raises.
As we've written before, we see similar patterns among teachers. Too many states are still operating stand-alone defined benefit plans without Social Security and without any elements conducive to portability. Among the teachers who get close to retirement, pensions do exert a “pull” retention incentive as they near their retirement age, but several studies have found a much larger “push” incentive at the back end, effectively encouraging veteran workers to retire when they might have more to give. When states have reformed their teacher pension plans in the past, the effects on teacher retention have been minimal.
2. Rising employee contribution rates can significantly weaken the benefits in traditional pension plans.
The graph below shows the net value of the federal pension plan for employees who started after 1983. Importantly, it shows three lines. Each of these lines captures the same gross benefit—that is, all workers since 1983 have the same pension rules about when they qualify for a pension, the formula for that pension, and when they can retire and begin collecting their benefits. The only difference is the amount of money the employees themselves must contribute to receive this identical benefit.
The top line signifies those who started between 1983 and 2011. They contribute just 0.8 percent of their salary, and almost the entire value of the pension is a net positive for them. That is, since they contributed almost nothing, all of their promised pension is a net positive to them.
But once the contribution rates rise for the same benefits, the results start to look different. The middle line represents the net benefit for workers hired between 2011 and 2013. Because they must contribute 3.1 percent of their salary for the same benefit, their net pension benefit doesn’t reach positive territory until they’ve been on the job for 16 years. Now look at the bottom, blue line. This is what the federal pension benefit looks like today, for all workers hired since 2013. Their required contribution rate is 4.4 percent of salary, and their net pension benefit will be negative for their first 20 years of service.

Even with the recent increases in employee contributions, it isn’t enough, and Congress, per the CBO report, is considering a range of different options, including further increasing contribution rates or cutting benefits.
These trends are hardly unique to the federal government. States are in the midst of their own contribution increases and benefit cuts, and as a result today’s teacher retirement plans are worse than those offered to prior generations. In the median state, a new young teacher today has to remain for 25 years before her pension benefit cross into positive territory.
The CBO also includes an extensive analysis of different options for further reforming the system in the future, including shifting to a pure defined contribution system with employer matching contributions of 10 or 15 percent of pay. The authors conclude that such proposals could offer similar total retirement benefits to workers at a lower overall cost. Read the full CBO report here.
South Carolina Governor Henry McMaster wants to shift all new teachers into district-run, portable, 401k-style retirement accounts. Although the details aren't fully available yet, the state already offers its teachers the choice to enroll in a well-structured defined contribution plan. That plan offers immediate vesting, a 5 percent employer match on contributions, and plenty of low-fee investment options.
Compare that to how bad South Carolina’s standard defined benefit plan is for teachers and taxpayers. Here are the basic stats on South Carolina's current plan:
- Less than 40 percent of South Carolina’s incoming teachers will stick around for 8 years, the minimum required to earn a pension;
- Less than one-in-four young teachers will teach in South Carolina for their full career and reap the large back-end benefits promised to them;
- Employee contribution rates have risen from 6.5 to 9 percent over the last ten years, meaning teachers are getting less in take-home pay for the same retirement benefit;
- South Carolina districts are already contributing about 13.4 percent of each teacher's salary toward the pension plan. That's up from 8 percent ten years ago, and a bi-partisan law passed earlier this spring will increase it by another 1 percent a year through 2022; and
- Most of those contributions are being used to pay down past debts, not to pay for actual teacher benefits. In fact, South Carolina employers contribute less than 2 percent of teacher salaries toward actual retirement benefits, which is below the national average and could leave teachers vulnerable to insufficient retirement savings.
Combined, this leaves South Carolina teachers in an expensive, back-loaded system. The vast majority are losing out in terms of retirement benefits, and all of them are losing out because their employers have to keep paying down pension debts. While we don't know the full details of the new plan yet, pension reform would likely benefit South Carolina's teachers and students.
To better understand the current situation in South Carolina, please watch and share the 3-minute video below:
Hoping to earn more? Man up.
In 2016, the 35 highest paid University of California employees were all men. Not most, not the majority. Every single one.
But this disparity isn’t exclusive to higher education – though it’s worth noting that the majority of the university’s high earners were doctors, and four were men’s sports coaches – the state’s K-12 education system reflects a gender gap as well.
In a country were 76 percent of teachers are women, we’d expect to see females as lead earners in a state’s public school system. But that isn’t the case. Just 15 of the state’s 50 highest K-12 school district earners are women. That same gender wage gap extends into retirement – just 12 of the top 50 beneficiaries in the California State Teachers’ Retirement System (CalSTRS) are women. And while we don’t have data on the racial make-up of this group, historically, these numbers are even worse for women of color.
We’re a pension blog, so while there are several systemic inequities at play here, we’re inclined to dig into this last number, 12 out of 50 beneficiaries. Across the country, most teachers (nine out of ten) are enrolled in a state-based defined benefit pension plan, like CalSTRS. These plans allot benefits according to a formula, multiplying years of experience, final average salary, and a pre-set multiplier, typically around 2.5 percent. Here’s an example:
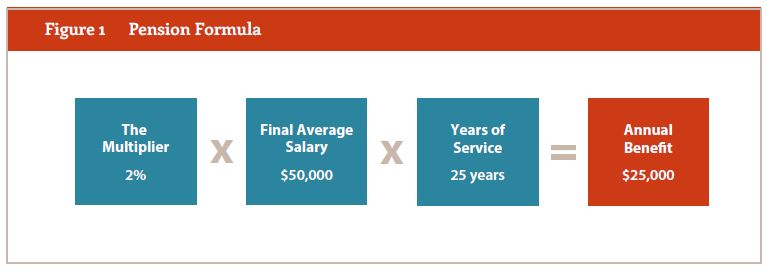
The final average salary variable works against women. It's not progressive at all, and the highest pensions go to the people with the highest salaries. In California as in most other states, the “teachers’” retirement system also happens to include a lot of higher-paid principals and superintendents, who are more likely to be men. We know that women make up the majority of the teacher workforce, but are then vastly underrepresented in higher-paying leadership roles. Survey data from the American Association of School Administrators (AASA) show that about 77 percent of school superintendents identify as male.
The fact that most of California's top pension recipients are men is a direct result of the state's back-loaded pension plan. A University of Arkansas study found that nearly two-thirds of CalSTRS entrants are pension losers. That is, the majority of California educators will either be ineligible for a pension or the pension they do qualify for is not worth as much as their own contributions plus interest. The current system creates a grous of winners and losers, and the winners are those who have both long careers and high back-end salaries. The people who fit that “winner” profile are disproportionately men.
Pensions are often billed as especially beneficial to women -- and, if a teacher were to spend the entirety of her career in the same system, she would earn a comfortable retirement. But we know that this isn't the case for the majority of teachers. In pensions as well as salaries, women are losing out to men.
