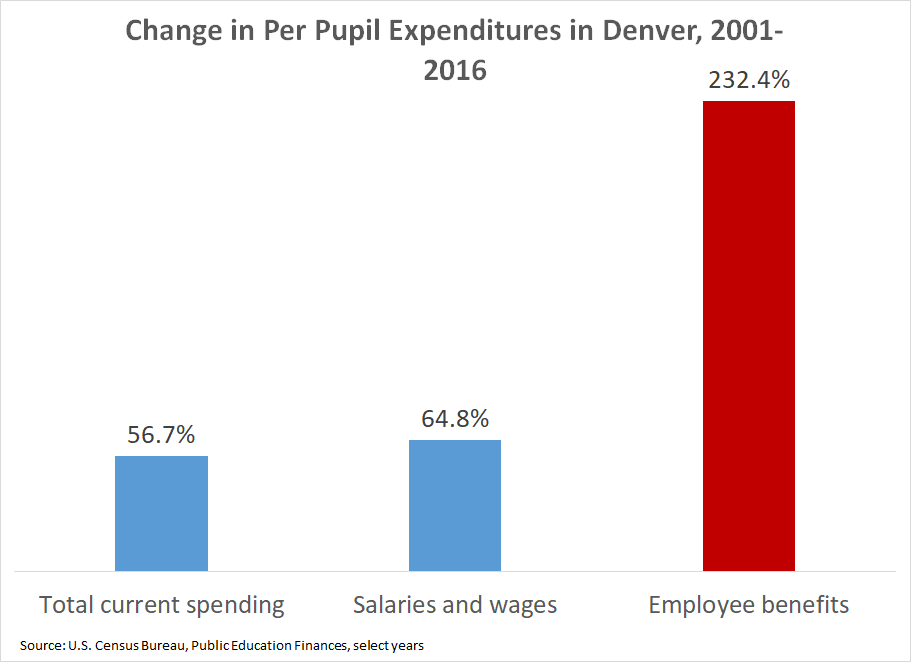
- Teachers in Denver, Colorado are on the brink of going out on strike. Given last year's statewide demonstrations in Colorado, West Virginia, Arizona, and Kentucky, not to mention the recent teacher strike in Los Angeles, it might be tempting to think of Denver as just one more data point in a larger national trend of teacher activism. But Denver is different for a few reasons.First, unlike the rest of the contry, teacher salaries in Denver have been going up. Denver teacher salaries have risen 4.1 percent a year over the last five years, which is a faster growth rate than its overall per pupil spending (see data on page 27 here). The district is now proposing a further 10 percent raise, and the union is requesting a raise of 12.5 percent. Those are much larger numbers than in Los Angeles, for example, where the union ultimately agreed to a 6 percent raise phased in over two years.Second, as Rick Hess notes in an excellent piece for Forbes, the Denver debate is largely over a pay-for-performance program called ProComp that began in 2005. The district and union are not all that far apart on total spending, but the disagreement is largely about how that money is allocated and whether it should go toward base pay or incentives.Still, if I were a Denver teacher, I would be upset about the district's inability to control spiraling benefit costs. While Denver has seen revenue increases and has been able to translate a good portion of that into higher salaries, the increases to base salary pale in comparison to Denver's spending on benefits. To show what this looks like, I created the graph below using data from the U.S. Census Bureau. As the graph shows, from 2001 to 2016 Denver increased current spending per pupil by 57 percent, and it increased spending on salaries and wages by 65 percent, but its spending on employee benefits soared by 232 percent. That is, Denver's spending on employee benefits rose about four times faster than its spending on salaries and wages.
 Part of this is due to changes in health care costs, but the state pension plan is also a big factor. Mandatory contribution rates to the Colorado teacher pension plan doubled between 2001 and 2016, and they've continued to rise since then.In fact, in legislation passed late last spring, Colorado cut benefits for new hires and further increased employee and employer contribution rates. As I showed at the time, the net result is a dramatic decline in the value of Colorado teacher retirement benefits. The graph below shows the value of a teacher's pension under the Public Employees Retirement Association (Colorado PERA) depending on hire date. Workers hired before 2011 were placed in a back-loaded plan that required them to stay 20 or 30 years before qualifying for a decent benefit (represented by the solid black line). But the state offers worse benefits to those hired between 2011 and 2020 (the gray line), and it will offer even worse benefits to teachers hired after 2020 (the red line).
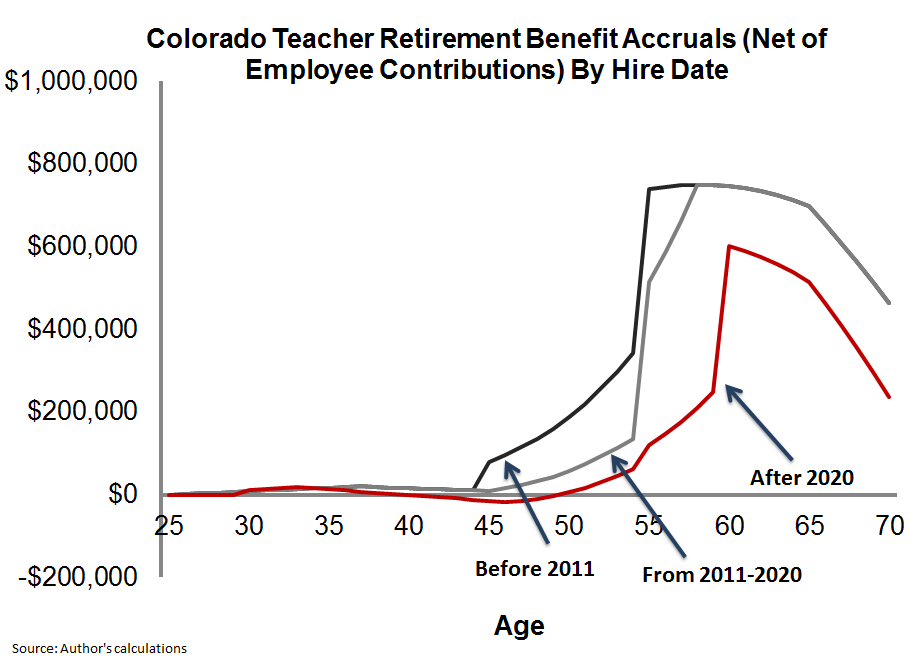 To be clear, Denver as a school district has no control over the statewide pension plan. Those rules are set by the legislature and apply to all educators across the state. But Denver teachers are getting a particularly raw deal. Denver has a relatively mobile teacher population, meaning fewer of its teachers will stick around to reach the back-end peaks built into the state pension plan formulas. And given its fast-growing population, Denver will have a disproportionately large share of teachers hired into the new, worse benefit tiers.These benefit issues may not get the same attention as the fight over base salaries, but Denver residents should be concerned about how their school district's budget is being spent and how little control they have over this important part of it.Taxonomy:
 Roughly 90 percent of all teachers are enrolled in a pension fund. However, each fund has its own rules and set of conditions that determine the overall value of a retired teacher's annual benefit. Interested in data on the average teacher pension in your state? See the chart below for the latest data, updating an earlier post!
The first column shows the “average pension” for newly retired teachers from the past ten years in each state. In the majority of states that don’t list the average benefit for newly retired members outright, these data are retrieved from states’ observations about retirees and beneficiaries added to the retirement plan’s rolls and about new benefit payments added to the rolls. These data are based on 2016 figures unless otherwise noted. Keep in mind that this method is not completely precise– these numbers also include beneficiaries added to the rolls because their spouses passed away, as well as potential increases in benefit payments due to inflation adjustments.
The next column shows, among all newly retired teachers, what the median retiree earns. The third column shows the average pension for all current retirees and beneficiaries. Finally, the last column show the estimated percentage of new teachers who will actually receive a pension. The data come from each state's annual comprehensive financial report.
In Maryland, for example, the “average pension” for new teachers is $24,409. But the median pension for new retirees is just $16,404, meaning half of all new retirees earn less than that amount. Moreover, 57 percent of new Maryland teachers are expected to leave the system before qualifying for a pension.
Average Teacher Pension by State State
Average Benefit for New Retirees
Median Benefit for New Retirees
Percentage of New Teachers Who QUALIFY FOR a Pension
Alabama
$22,335.81
$22,512.00
39
Alaska (DB plan)
$34,605.15
-
39
Arizona*
$19,770.85
$20,604.00
100
Arkansas
$22,830.26
$17,592.00
57
California
$49,267.69
$51,000.00
69
Colorado
$40,784.73
$39,247.02
36
Connecticut
$53,452
-
55
Delaware*
$21,792.62
$27,024.00
29
Distrct of Columbia
$30,828.83
$53,172.00
36
Florida* (y)
$22,214.86
$18,316.77
28
Georgia
$43,192.11
$23,760.00
29
Hawaii*
$9,361.05
$27,816.00
25
Idaho*
$20,041.00
$20,088.00
70
Illinois
$49,560.00
$55,140.00
50
Indiana (Pre1996 Fund)
$27,695.90
$21,000.00
31
Indiana (1996 Fund)
$18,735.43
$15,000.00
31
Iowa*
$20,262.50
$15,036.00
42
Kansas*
$17,052.00
$11,400
45
Kentucky
$46.576.38
$38,824.00
67
Lousiana
$27,324.25
$27,000.00
54
Maine*
$28,421.00
$25,260.00
14
Maryland*
$24,409.20
$16,404.00
43
Massachusetts
$43,642
$41,174
12
Michigan
$28,148.37
$20,892.00
50
Minnesota (All retirees)
$27,593.21
$29,400.00
50
Mississippi*
$18,927.72
$19,656.00
22
Missouri
$36,302.51
$30,000.00
58
Montana
$29,110.82
$24,631.00
35
Nebraska*
$23,611
$24,328
32
Nevada*
$35,683.23
$30,000.00
57
New Hampshire
$19,597.82
$21,000.00
31
New Jersey*
$40,175.17
-
56
New Mexico
$22,815.81
$19,512.00
33
New York
$47,431.70
$51,360.00
40
North Carolina
-
-
47
North Dakota
$29,508.20
$22,452.00
56
Ohio
$66,416.82
$48,258.00
34
Oklahoma
$24,369.40
$21,000.00
44
Oregon
$37,793.86
$20,520.00
46
Pennsylvania (2015)
$19,797.56
$25,836.00
36
Rhode Island
$25,102.82
$27,000
59
South Carolina*
$20,528.17
$15,000.00
37
South Dakota*
$16,286.07
$12,300.00
53
Tennessee
$22,751.41
$24,588
56
Texas
$24,920.93
$24,588.00
59
Utah (noncontributory)
$18,569.27
$14,352
52
Utah (contributory)
$29,823.33
$35,136
52
Vermont (y)
$20,277.91
$20,750.5
33
Virginia
$22,770.89
$18,852.00
50
Washington (PERS 1)
$28,203.65
$26,529.84
67
Washington (PERS 2)
$20,775.48
$18,311.28
67
West Virginia
$21,415.35
$18,000.00
25
Wisconsin
$22,911.00
$13,392.00
64
Wyoming*
$24,506.79
$13,500.00
42
*Includes all public employees
(y) Indicates data based on 2017 figures.
Knowing what your state’s “average pension” can be interesting. But this amount doesn’t necessarily reflect the amount that many teachers actually earn. Below are four important caveats about the data you’re looking at:- Not all teachers qualify for a pension. States can and do set relatively high minimum service requirements, ranging from five to 10 years, and over half of incoming teachers won’t qualify for retirement benefits in their state. Leaving these teachers out of the overall pool obscures who gets counted in the “average pension.”
- Of the teachers who do qualify for benefits, their benefits will vary widely. The statistical average, or mean, hides the fact that only a small percentage of incoming teachers will receive a full career pension at retirement, while many, many more get only a small amount. Also, teachers in 15 states aren't covered by Social Security; pensions in these states tend to be larger to make up for this fact.
- These amounts only tell us what a teacher earns at retirement—not what she contributed to her state or local system. The averages include many teachers who qualify for some pension, but those pensions may be worth less than the value of the teacher's own contributions.
- In many states, teacher pension plans have created newer, less generous retirement tiers for newly entering members. If you’re a new teacher and you live in a state with a tiered plan, your retirement plan could end up looking significantly more meagre than the numbers below.
Taxonomy:There's a Zora Neale Hurston quote that I love, because it's applicable to the human existence AND teacher pension blogs. Ready for it? "There are years that ask questions, and years that answer." If we're speaking of teacher pension blogs, 2018 was a year that asked. Four of our top five posts this year were questions. Teacher pension plans are inarguably complicated, so it's really no surprise that the most high traffic pieces published in 2018 were ones that shed light on a complex issue. Check them out below, plus one extra post highlighting our most asked question of all time.
1. Do Teachers Get Paid Over the Summer? One of the most common teacher salary questions is whether or not teachers get paid over the summer months. So, do they? Not the most satisfying of answers, but, it depends. Teacher payroll schedules vary district-to-district; some allow workers to spread their 10-month salary over 12 months, while others don’t give any paycheck during the summer months, requiring teachers to budget well, or in some cases, get a second job.
2. I'm a Public School Teacher. When Should I Retire? Although the decision about when to retire is a personal one involving many factors, in most states there is a very clear window during which a teacher can maximize his or her retirement wealth. As explained in this post, teachers can receive the most total money in pension benefits by following two rules: stay in the same pension plan for as many years as possible, and then retire at their state’s normal retirement age.
3. New Study: Three-Fourths of Massachusetts' Educators are Pension "Losers" A large group of Massachusetts teachers will receive pension benefits worth less than even their own contributions. How long they must stay depends on their age when they entered the profession. As shown in this post, a 25-year-old new teacher in Massachusetts won’t qualify for benefits worth more than her own contributions unless she stays more than 30 years.
4. Just How Expensive and Generous Are Teacher Pension Plans? Many people assume that an "expensive" retirement plans must obviously translate into generous benefits for workers, but that's not always true. If an employer contributes more money to a 401k plan, that money goes directly into workers' accounts. But that's not how most teacher pension plans work. This post digs into the nuance of teacher pension plan structure.
5. How Do You Calculate a Teacher Pension? Teacher pension systems can be quite complex. There are specific rules that vary state-to-state that affect any given teachers’ annual pension benefit after retirement. There are wider contexts to consider as well. This posts walks through a typical teacher pension formula, while also highlighting state-specific variables, like Social Security coverage and vesting periods.
Finally, a New Year's bonus: our most viewed post, year-after-year, details the average teacher pension in each state. This year, my colleague Max Marchitello put in the work to update the post with the most recent data available. You can find it here.
Taxonomy:Which state has the best (or worst) retirement plan for teachers?
There are lots of ways to answer that question. In the past, we've graded states based on a number of factors, such as how long states require teachers to stay before qualifying for a benefit (aka the "vesting" period), how long teachers would need to stay to qualify for an adequate benefit, and whether the state is keeping its unfunded liabilities in check.
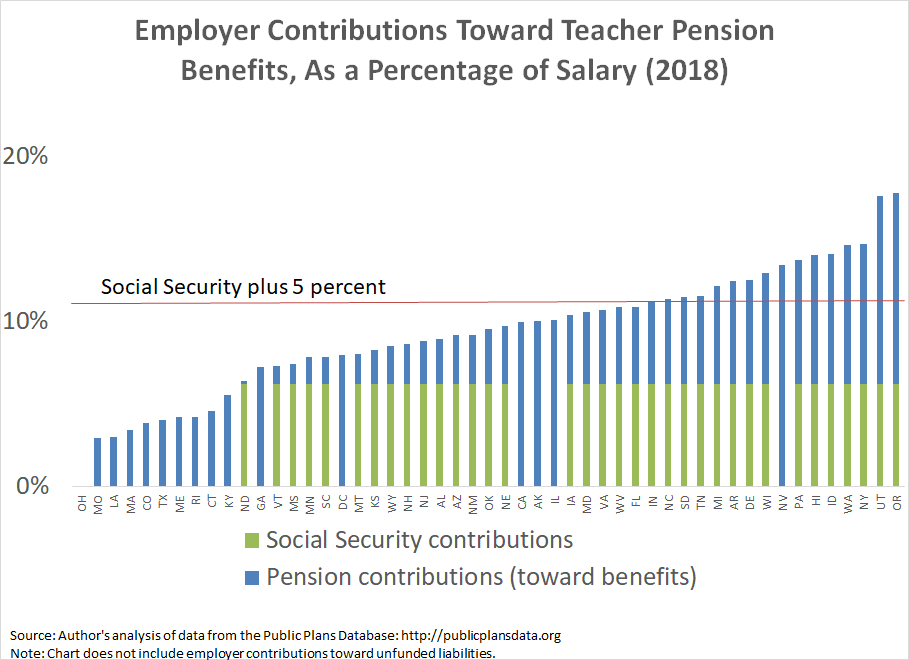
But perhaps a simpler answer is to look just at how much states say they are contributing toward teacher retirement benefits. The graph below plots the results. It adds together each state pension plan's "normal cost" of benefits* plus Social Security contributions. Most experts recommend that employees save 10-15 percent of their salary each year toward retirement, in addition to Social Security. Assuming that employers are responsible for half of that amount, I've included the horizontal red bar as a signal for an adequate employer contribution rate. Purely in terms of contribution rates, 16 states meet this adequacy threshold, while 34 states and the District of Columbia do not.
In fact, while we may take Social Security for granted in the private sector, this chart illustrates just how important it is for teachers. Out of the 15 states plus D.C. that do not offer their teachers Social Security benefits, just one, Nevada, reaches the adequacy threshold.
Another way to say this is that the majority of the worst-performing states are all non-Social Security states. Under Ohio's defined benefit pension plan, for example, teachers are not getting any employer-provided retirement benefits at all. (See here for an explanation of how that's possible.) In fact, 10 states--Ohio, Missouri, Louisiana, Massachusetts, Colorado, Texas, Maine, Rhode Island, Connecticut, and Kentucky--are contributing less toward teacher retirement benefits than most employers are required to contribute to Social Security alone.
In the median state pension plan, employers are contributing 4.5 percent of salary toward teacher retirement benefits. Compared to employer contributions toward private-sector 401(k) plans, that 4.5 percent contribution toward retirement benefits could be consider good but is also not overly generous.
There are a couple other important distinctions here. In a 401(k), an employee's benefit is directly related to their employer's contribution rate. But that's not true under teacher pension plans, where benefits are delivered via formulas tied to the worker's salary and years of service. That is, the employer contribution rates in pension plans are the plan's best guess for how much benefits are worth on average across all employees in the plan. As a result of the way those formulas work, long-serving veterans receive much more generous benefits than short- and medium-term workers. That means some fraction of teachers even in low contribution states will receive adequate retirement benefits. But the majority of teachers, even in higher-contributing states, will earn much less than the plan's average. This is especially true for the most recent generation of teachers, because states have been cutting benefit formulas for new hires. States typically do not report what those averages would look like for different groups of teachers, but the figures would certainly look even worse for new teachers than the averages reported here.
These numbers also rely on each plan's own assumptions for how much its benefits are worth. Those calculations are tied into the plan's assumed rate of return, which many experts believe are too aggressive.
Still, if we take states at their own words, the benefits they're providing are not all that generous, on average. The biggest problems on the benefit side are tied to an overall lack of generosity, an inequitable distribution of how benefits are delivered, and the lack of Social Security in some states. These problems are fixable, but they would require states to think differently about how to structure their retirement benefits so that all teachers received adequate retirement security.
*States break down their pension contributitions into two buckets. The numbers in this post rely solely on the first category of pension contributions, called the plan's "normal cost." Expressed as a percentage of salary, it's the amount of money that the state's actuaries think the plan's benefits are worth, on average across all members in the plan. Although not included here, states are also making significant contributions toward the second category of pension spending, the plan's contribution toward any unfunded liabilities, often referred to as the plan's "amortization costs." For more background on this distinction, see this post. The contribution rate data in this post comes from the Public Plans Data (PPD) from the Center for Retirement Research at Boston College. Note that all figures in this post refer to state-run teacher pension plans. In the case of a state like Alaska, which has closed its pension plan to new workers, the figures reflect the closed plan's benefit levels.
Barring a last-minute agreement, teachers in Los Angeles Unified School District (LAUSD) plan to go out on strike beginning Thursday. There are a number of factors driving the impasse, including fights over base salaries, class sizes, and charter schools, but one factor that's getting less attention is how much the district is spending on benefits for its employees.
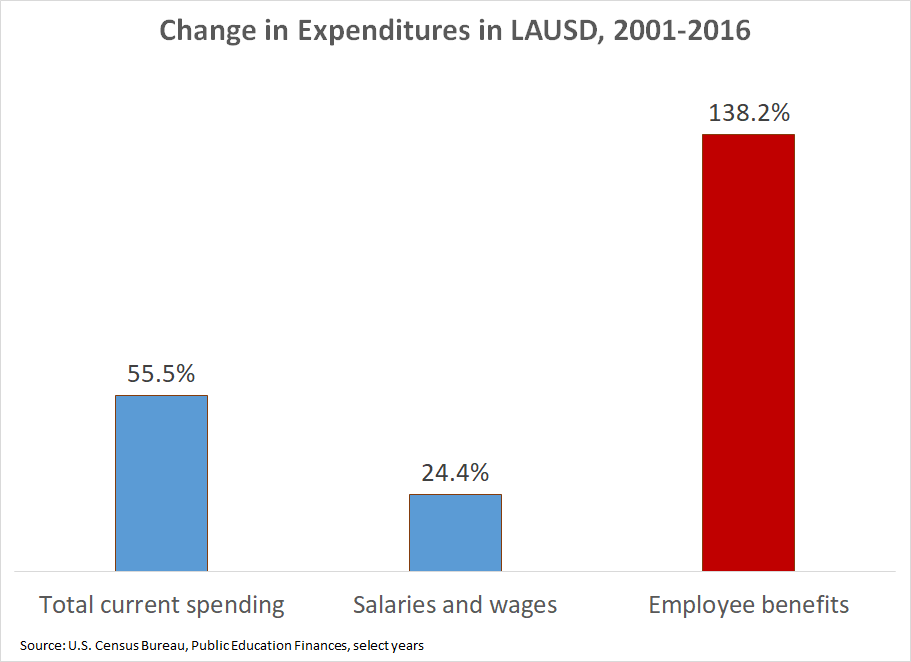
Consider the graph below, using data from the Census Bureau's Public Education Finances reports. From 2001 to 2016, LAUSD increased overall spending by 55.5 percent, but its spending on salaries and wages increased just 24.4 percent. Meanwhile, employee benefit costs soared 138 percent.
LAUSD is an extreme example, but this situation is playing out across the country. More and more of our nation's education spending is going toward benefit costs, due to significant increases in pension and healthcare costs.
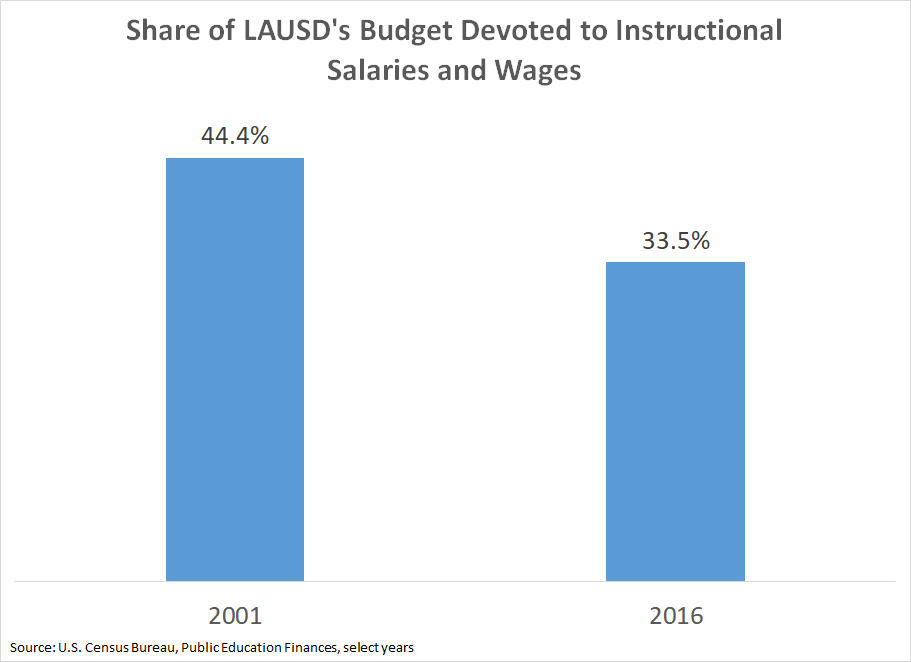
Another way to slice the same data is to look at the percentage of our education budgets that are being spent on the salaries and wages of teachers who work in instructional roles. Again, the national trend is not positive, and LAUSD is no exception. In 2001, L.A. devoted 44 percent of its budget to teacher salaries and wages; by 2016, that figure had fallen to 33.5 percent.
As mentioned above, rising pension and healthcare costs are squeezing school districts' discretionary budgets and taking away dollars that could otherwise go toward hiring more teachers or paying them more money. These trends are still accelerating. In California, for example, the state has been ratcheting up employee contribution rates toward the state pension plans, CalSTRS and CalPERS, and rates will continue to rise through at least 2021.
LAUSD has also created its own problems locally. At one point, the district promised free medical, dental, and vision coverage to all retirees with at least five years of service, and their spouses. It has gradually limited who is eligible for those benefits, but the district still doesn't require any retiree contributions toward those health care benefits. This year alone, LAUSD will spend $314 million on those benefits, which is the equivalent of more than $500 per pupil or $12,500 per teacher. Those costs are project to rise significantly over time.
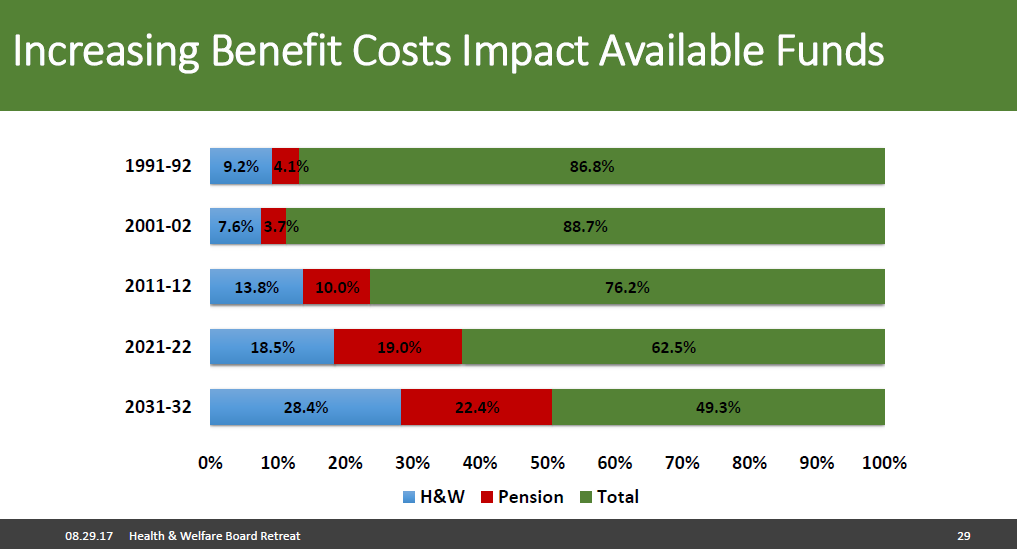
In fact, the long-term budget outlook in Los Angeles looks particularly depressing. As I wrote about last year, the district projects to spend more than half of its budget on healthcare and pension benefits by the 2031-32 school year:
None of these trends are positive, and in fact most of the cost increases will be used to pay for the unfunded promises of the past, not for any new benefits for current or future workers. As you follow the news of the pending teacher strike this week, consider how L.A. got in this situation and whether any of the solutions on the table will make a dent in these long-term trends.
Taxonomy:Earlier this fall, the Education Writer's Association invited me to lead a session for their members about key data points reporters can mine to inform their coverage of the teaching profession. I spoke about publicly available data, particularly from state-run teacher pension plans. While much of that data is buried in long pdf files called "Comprehensive Annual Financial Reports," the reports contain answers to a number of questions that reporters frequently confront in their coverage. I highlighted four main lines of inquiry:
- School spending: How is education spending changing in my state, overall and across broad allocation categories?
- Pension contributions: How are contributions changing over time?
- Educator salaries: How much are educators paid, and how is that changing over time? How fast are salaries growing today versus in the past?
- Educator turnover rates: What are the turnover and retention rates for educators? Are there differences by gender, between different professions, or over time?
Since the meeting took place in Illinois, I chose to provide examples from the Teachers' Retirement System (TRS) of Illinois and other comparisons within the state, but reporters can find similar data in their own states. See my slides below:
For anyone having trouble finding these data for their state, please reach out to us at teacherpensions@bellwethereducation.org.