Merely vesting in a pension plan is not sufficient to guarantee a decent benefit, and many vested teachers would be better off withdrawing their contributions than waiting to collect a pension.
That reality has taken me a while to grasp, because it's counter-intuitive, and because vesting in other types of plans matters much more. So let me start by explaining how vesting works in defined contribution, 401k-style plans. In a defined contribution plan, the employer makes a contribution as a percentage of the employee’s salary. Employees qualify for those employer contributions after they reach a certain number of years of service, called the vesting period. Employees who leave before vesting forfeit their employer's contributions.
Say an employee starts out with a salary of $40,000, and the employer contributes 5 percent into the employee’s 401k. In the worker's first year of employment, the employer contributes $2,000 (5 percent of $40,000) to the employee's 401k, but that money is not vested yet. The employee is entitled to that money only if he or she reaches five years of service; short of that, and the employer keeps it.
This is part of the reason why, in a new report out this week, we found that immediate vesting would significantly improve the percentage of workers who qualified for adequate retirement benefits in defined contribution and cash balance plans. In contrast, immediate vesting would do virtually nothing for the vast majority of teachers in defined benefit plans. That's because vesting works differently in these types of plans.
An example may help here. Consider the case of a 25-year-old teacher who started her career last fall in Los Angeles. She’s automatically enrolled in the California State Teachers Retirement System (CalSTRS). CalSTRS has a five-year vesting period, which means she’ll first qualify for retirement benefits if she leaves after her fifth year of service, at age 30. But she won’t be eligible to begin collecting her pension benefit until she reaches age 62, in the year 2055, and it will be based on her salary in her final years of service, in the year 2023. By the time she's able to begin collecting, inflation will have significantly worn away her benefit.
Critically, this distinction affects young teachers much more than older ones. That’s because older teachers are already close to retirement, and they won’t have to wait as much time for inflation to wear away their benefits.
The graph below, from an Urban Institute report by Richard Johnson and Benjamin Southgate, helps show what this looks like. Each line represents the value of a teacher’s pension benefit, net of her own contributions, depending on when she started teaching and how long she serves. I’ve added an arrow pointing to the five-year mark when teachers in California qualify for a vested pension from CalSTRS. Note that, while all teachers technically qualify for a pension after five years of service, that benefit is negative for all teachers hired at age 25 or 35. It’s only for teachers hired at age 45 or 55 where vesting produces a positive net benefit.

To put this in perspective, consider that most teachers begin their careers in their 20s or 30s. According to data from the National Center for Education Statistics, only about 7 percent of California teachers began their teaching career at age 45 or later. Another way to say this is that vesting produces a positive benefit for only 7 percent of California's incoming teachers. Of course if they continue teaching their benefit will continue to grow, but as the graph above makes clear, California teachers may have to stay for 15, 20, or 25 years before realizing a positive net pension.
Teachers who leave the system also have the option of withdrawing their own contributions, but even vested teachers in most states do not qualify for employer contributions. That's true in California as well. For many departing teachers, cashing out and withdrawing their own contributions is often a better deal than leaving their contributions with the plan and waiting to collect a pension. In doing so the employee forfeits the guarantee of the pension, but that’s often the right financial decision.
States know this too. In a piece last year for The 74, I noted that North Carolina dropped its vesting period from 10 years to five after finding the change cost very little. Other states could likely do a similar analysis and find that their vesting periods are largely symbolic. Moreover, when we looked at the data on teacher behavior right around vesting periods, we found that teachers do not stick around longer just to vest in their state's pension plan.
Given the data I've explained above, teachers are making a rational decision to ignore vesting periods when they're deciding whether to remain in teaching or not, but that means vesting periods are really only accomplishing two things. First, vesting periods do limit the retirement benefits earned by teachers who enter the profession in their 40s and 50s. Second, for younger teachers, vesting periods are forcing risk-averse teachers to choose between withdrawing their contributions or waiting for a "guaranteed" pension, even if that pension might be worth less than the teacher's own contributions. In both cases, vesting periods help the finances of state pension plans, but they're bad for teachers.
Our news cycle is lightning quick. Proponents and naysayers alike are often loudest just prior to a policy change’s implementation, before moving on to tackle the next one. But what happens after the dust settles? Were the changes as meaningful as supporters hoped? Were ramifications as cutting as detractors warned? We don’t always get the chance to go back and check.
Alaska’s 2005 teacher pension system reform legislation provides a unique opportunity to do just that. We’ve collected pre and post reform data to examine teacher workforce impact in the wake of retirement plan changes. While it is important to note that these trends should not be interpreted as causal, we feel there are meaningful takeaways all the same.
But first, some history. In a 2005 special session, the Alaska state legislature passed retirement reform laws, effectively freezing the state’s existing defined benefit pension plan, and enrolling new employees in a 401(k)-styled defined contribution plan. The state faced a $5.7 billion unfunded liability, and while changing the plan structure would not eliminate that debt, it would prevent it from snowballing further. Critics were concerned that the switch would cause teachers to leave the profession in droves, or never enter it at all, citing pensions as a key recruitment and retention incentive.
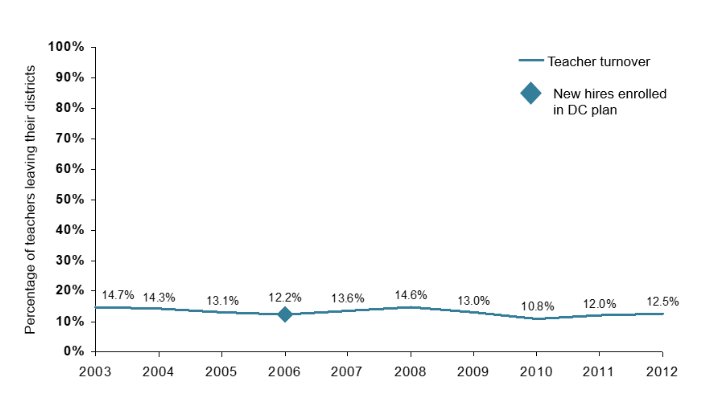
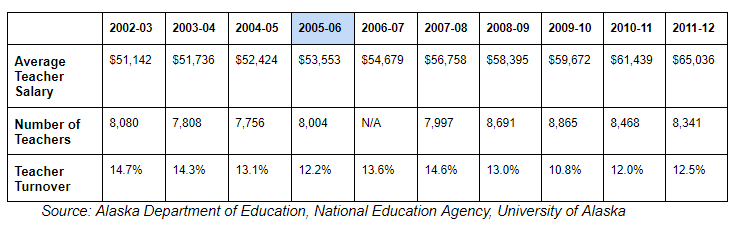
So what actually happened? Not much. The table below tracks the average Alaska teacher salary, the number of teachers in the state*, and the percentage of Alaska teachers leaving their district in a given year. The 2005-06 school year is highlighted to denote the policy change. Alaska’s average teacher salaries have risen steadily from 2002 to 2012. The number of teachers has fluctuated over that time, but remained largely consistent.
And teacher turnover, one of the biggest concerns going into the reform, has remained steady as well. The chart below tracks the percentage of Alaska teachers who left their district each year (including those who leave the profession entirely or moved to a different school), and highlights the new hire cohort first enrolled in the new retirement system. Warnings of dramatic teacher shortages in the wake of retirement plan changes have not come to pass.
This is not to say that Alaska’s reform is a perfect exemplar. The DC plan sets decent contribution rates, with a mandated 8 percent employee contribution and a 7 percent employer contribution, but in passing the 2005 reform legislation, the state missed an opportunity to extend Social Security coverage to its teachers. As a result, Alaska teachers continue to be uncovered, putting their retirement security at risk. The plan isn’t ideal, but it does offer better benefits to a larger group of mobile workers, and it should help keep the state’s finances stable over the long-term.
Pensions make up an increasing portion of a state’s education spending and any changes to the plans must be balanced to both do right by new hires as well as uphold promises made to existing employees. There are no easy answers, but taking opportunities to examine results in case studies like Alaska allow future policy makers to cut through some of the discourse.
*Classroom teachers, includes part-time
No offense intended, but actuaries typically are not the bearers of good news. Broadly speaking, actuaries are the people who count money and warn about a rainy day. While most policymakers and CEOs don’t like seeing them coming, actuaries perform a critical function and help ensure that governments, companies, and other entities have enough money set aside for future costs or unexpected expenses.
A recent, one-of-a-kind study from the Society of Actuaries presents a mixed bag: good news for some, and greater expenses for others. After studying more than 100 public retirement systems from 2008 to 2013, across 46 million life-years, they found that teachers have the longest life expectancy of all public employees. Over this period, female teachers on average lived to be 90 years old, and the typical male teacher is expected to live till they’re 88.
Great news, right?
For teachers, absolutely. These findings suggest that in general teachers enjoy a comfortable retirement with sufficient financial support. The fact that most teachers will live into their ninth decade is particularly encouraging given that the average American life expectancy fell for three consecutive years.
Living longer, however, carries consequences for states. Approximately 90 percent of teachers are enrolled in state pension systems. This means that qualified retirees earn an annual pension benefit that is derived from a number of factors, such as years of experience and their final salaries, and a teacher pension is a lifetime benefit. In other words, unlike a 401k, an individual’s pension cannot run dry. The state is obligated to pay the annual benefit for each year of the retired teacher’s life.
Thus, the longer a retired teacher lives, the more valuable their pension becomes. This carries serious implications for state pension funds. These funds, relying on the help of actuaries, base their funding levels, at least in part, on life expectancy estimates. If states are using outdated data or less optimistic life expectancy tables, then they’re likely underfunding their pension systems. In addition to the longstanding tradition of state legislatures simply not providing the actuarially determined level of funding necessary for their pensions to keep up with their obligations, this would mean that even the level of financing recommended by the actuaries may have been too low.
With virtually every state facing a teacher pension crisis, it is vitally important that state pension systems have an accurate picture of their retiree’s life expectancy. While it is likely that the conditions will vary, states should carefully assess their life expectancy estimates and, as necessary, realign their funding levels so they can meet their obligations over a longer term than they may have anticipated.
The following is a guest post from Ryan Frailich, a Certified Financial Planner. He started his career teaching in Mississippi, before moving to teach in New York City and then New Orleans. In the first decade of his working career, Ryan ended up with one state pension and three different 403(b) plans. Upon researching his situation and learning more about the state of retirement for teachers, Ryan switched careers and then became a financial planner with a focus on helping young couples and educators plan for their financial lives.
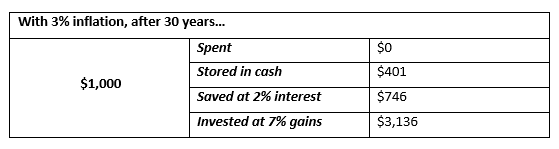
The chart below is something everyone “knows,” but most people forget about for 99 percent of their lives. Inflation, a concept all of us are exposed to in high school economics class, is the slow moving force behind those stories your grandfather told you about going to the movies for 25 cents, or buying a bottle of coke for a dime. Yet when it comes to the impact on teacher’s retirement plans, people are in the dark.
Teacher pensions are a struggle to write about because there’s a chasm between what’s promised and the outcomes for the overwhelming majority of teachers. I believe all teachers should get the benefits promised to them, but here in the real world, we have to face the fact that the commonly held notion of a teacher working 30-35 years and retiring with a gold plated pension is largely fiction. The small number of teachers who actually reach breakeven has been widely covered, not to mention the even tinier fraction of beginning teachers who actually reach full retirement age. Setting aside those issues for a moment, let’s take a look at what happens to a teacher who starts in a retirement system, spends 30 years in it, and retires.
I’m in Louisiana, so let’s take a teacher who started in 2018 in the Baton Rouge schools. Let’s call this teacher James. James is 22, right out of college, and the starting salary for a brand new classroom teacher is $44,500. James stays in the district his entire career, earns a Master’s degree along the way, and retires 30 years later with a peak salary of $67,200.
Using the Teacher’s Retirement System of Louisiana’s pension calculation, we calculate his benefit the year after he retires as follows:
Years Worked * Pension Multiplier * Highest three years average salary
30 * 2.5 * $66,200 = $49,650
Wow! He can stop working and go on collecting $49,650 from age 53 until whenever he passes away. Or can he?
Enter the inflation monster.
History isn’t entirely predictive, but let’s use historical inflation to see what happens to the real dollar value of James’ pension over time. The consumer price index rose 2.54 percent per year, on average, from 1988-2018, so we’ll use that as our estimate of the next 30 years.
Technically, TRSL offers a cost of living adjustment that can be about 1.5 percent per year, so we’ll factor that in for now. As we’ll get to later, that’s another one of those things that’s promised on paper until you read the fine print.
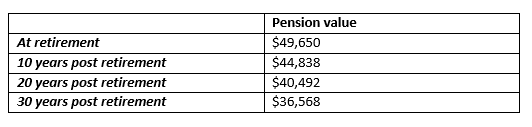
With the numbers cited above, the table below captures the current value of his pension at ten year increments into the future.
Ugh. Now, at 82 years old, James has to find a way to make up for the fact that his pension has lost 26.3 percent of his purchasing power to inflation since he retired.
The above assumes that TRSL awards that 1.5 percent cost of living increase every year, but historically that hasn’t been the case. TRSL has rules governing when a cost of living increase can be awarded, and those rules are incredibly complex, but essentially hinge on 3 things:
The funded ratio of the plan
The past year’s investment returns &
approval from the state legislature.
Translation: It’s not happening annually. In 2016, Louisiana teacher retirees got their first cost of living adjustment in eight years, and it was 1.5 percent. If we know his pension loses 26 percent of its value while getting a yearly cost of living adjustment, imagine how bad it looks if he only gets one every eight or so years.
This scenario I’m presenting is, in all reality, the best case scenario for many teachers in Louisiana. There are a variety of other scenarios in which the payout looks even worse.
It’s worse because whatever meager Social Security a teacher in Louisiana may be eligible for would get reduced due to the windfall elimination provision. I say meager because years spent teaching in Louisiana are years not spent contributing to Social Security, so career teachers may only have sporadic income from college or post retirement to earn Social Security credits.
It’s worse because just over one quarter of teachers who enter the system even get to the roughly 20 years required to break even, adjusted for inflation, on their own contributions. And if you leave the system, the amount you can withdraw and put in your own IRA has sat, uninvested, without interest, for years.
It’s worse because if you decide to leave your contributions with the state of Louisiana, and draw your pension in the distant future, inflation erodes it all along the way. Say James stops teaching after 15 years and changes careers, but wants to draw his pension. The pension won’t be accessible for him until age 62 (age 60 for some retirees). Those 24 years of inflation at 3 percent leave what would’ve been an annual payment of $19,331 worth just $9,306 per year.
It’s worse because the Louisiana pension has been underfunded for years, so at some future, indeterminate point, it’s possible the benefits that do exist will be reduced.
If one of the best outcomes for a new teacher entering the system is one in which their pension payout loses 26 percent of its value over a 30 year retirement, then thousands of teachers get even worse.
What You Can Do About It
There are a host of policy changes I’d love to see, but for this article, let’s stick to what’s in your control.
- Max out a ROTH IRA. I encourage all teachers to contribute to a ROTH IRA, and work to max out the annual limit whenever possible. This will give you a post-tax pot of money to draw on and supplement your pension in retirement years.
- Use the 457 or 403(b) Plan (with caution). Most districts have either a 403(b) plan, a 457 plan, or both. These are retirement plans that allow you to put much more money in each year than an IRA. But use caution because 403(b)’s are rife with horrendous investment options and investment fees I wouldn’t wish upon my worst enemy. Do your homework before committing to one of these plans, but when you find a good one with reasonable fees and adequate investment options, it will provide a tool to start building money you can rely on if your pension falls short of fully meeting your long term needs.
- Adjust your expectations. New teachers need to go in with eyes wide open, and know that the odds are against them in getting the gold plated pension. Being clear eyed about this helps people know well in advance, and better prepare for it.
- Decide on a career path early. This is hard because my advice is to decide in the first few years of your career whether you’re going to stick with it for the long haul or not. That is obviously easy to say but much harder to implement given all the life variables that come peoples way. That said, if you are going to make a full 20+ year career of teaching in one state, you’ll do okay with your pension. If you work 2-4 years and move on, the decision to withdraw your contributions and invest in an IRA is easy. The challenge is hardest for people who have 8-15 years in the system, and either way they choose comes with significant downsides.
To me, it’s a shame that so many teachers will end up having inadequate resources to retire on. If I could wave my magic wand and give teachers a pension option that met the needs of the majority of teachers, I would do it in the blink of an eye. Teachers deserve better than the disjointed, underfunded, and inadequate system most have access to.
Barring any unexpected developments, teachers in Oakland Unified School District (OUSD) in California are set to go on strike this Friday. Much like their colleagues in Los Angeles Unified School District (LAUSD), Oakland’s educators are seeking a pay increase and smaller class sizes.
Based on data from the California Teachers Association, it looks as though Oakland’s teachers may have a case. OUSD offers a lower beginning salary compared with other districts in California, as well as lower salaries on average and at retirement. As such, the Oakland Education Association (OEA) is demanding as 12 percent raise over three years. These numbers are double the union’s ask in LAUSD earlier this year, but mirror the demand in Denver.
Whether the raise is warranted or not, it will be difficult for OUSD to afford it given that it faces a more than $20 million budget shortfall. Due to their budget constraints, the district has offered only a 5 percent salary increase.
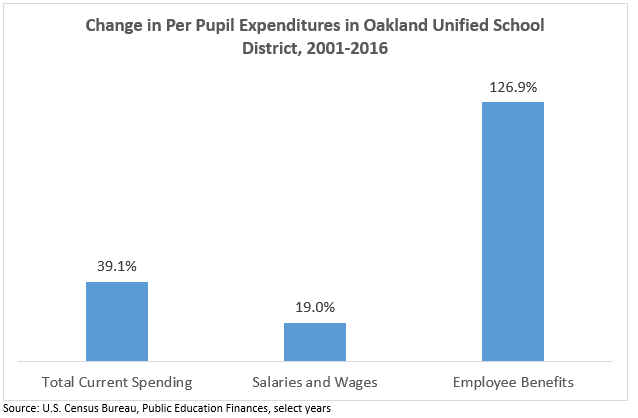
While Oakland has seen increases in per pupil expenditures over the past three years (see slide 20), increases in benefit spending far outpace the growth in overall K-12 spending or teachers’ base salaries. To demonstrate this, I created the graph below using data from the U.S. Census Bureau. From 2001 to 2016, Oakland increased its current per pupil spending by 39 percent and salaries and wages by only 19 percent. The district’s benefit spending, however, skyrocketed by 127 percent. In other words, Oakland’s spending on employee benefits increased nearly 7 times faster than its spending on salaries and wages.
Due to the state’s more than $107 billion unfunded liability, the California pension system has undertaken serious contribution hikes that affect teachers, but really squeeze district budgets. As my colleague Kirsten Schmitz demonstrated, by 2021, nearly 40 percent of teacher salaries will go to benefits and the brunt of the burden will be borne by districts. Districts will pay 19.1 percent of teacher salaries to benefits, an increase of more than 130 percent since 2014. And to make matters worse, the majority of these new funds are earmarked to pay down debt rather than funding actual benefits. Indeed, most incoming California’s teachers will never even see a pension benefit and instead are simply subsidizing retirees and a relatively small number of long-term teachers.
Oakland’s teachers are understandably concerned about their base pay. And while it likely won’t garner the same attention as the salary fight, they should also be worried about rising benefit costs and the impact it has on Oakland’s education budget.
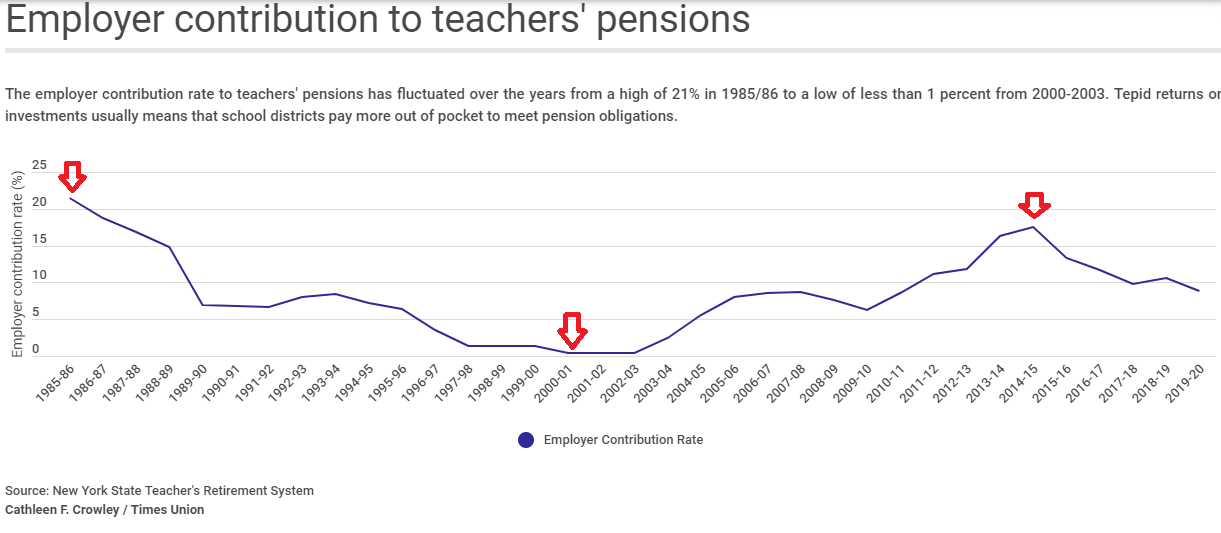
Taxonomy:Last week the state of New York announced that, due to gains in the stock market, the employer contribution rate for its teacher pension plan, NYSTRS, would fall from 10.62 to 8.86 percent of payroll. This is obviously good news, and it will save New York school districts an estimated $300 million in the 2019-20 school year.
NYSTRS is often cited as one of the leaders in the public pension world, mainly due to its relatively high funded ratio (97.7 percent as of 2017). Unlike other states, where contribution rates are set in statute or determined annually by the whims of state legislators, NYSTRS regularly contributes exactly what its actuaries say the plan needs.
And yet, there are problems with this model too. As this excellent graphic from Cathleen F. Crowley at the Albany Times Union shows (I added the arrows), the downside of this approach is extreme volatility. NYSTRS' employer contribution rates have fluctuated from a high of 21 percent in 1985-86, down to less than 1 percent from 2000-3, only to rebound up to 17.5 percent in 2014-15. School districts are handed these contribution rates with no choice, and they can force significant changes to district budgets when contribution rates can nearly triple in five years' time, as they did from 2009-10 to 2014-15, or halve, as they've done since then. Districts are given a few months of advance notice--the rates for 2019-2020 were just announced, for example--but this volatility can still make for painful setbacks in some years or surprise windfalls in others.
New York's roller coaster contribution rates and high funding ratios may earn plaudits on the financial side, but they have not made the state immune to the benefit cuts affecting teachers in other states. In fact, NYSTRS has aggressively cut benefits for new workers over time, and today it operates six tiers of benefits that depend on the employee's start date. New workers hired after 2012 have the least generous benefits, followed by those hired between 2010 and 2012, and so on. New York also requires teachers to stay 10 years before qualifying for retirement benefits, a requirement that would be illegal in the private sector.
All of this should serve as a reminder that a plan's financial status may or may not have any relationship to how well it works for its members. NYSTRS has maintained its high funding ratio at the expense of both employees and employers.
Taxonomy: