After spending a lot of time writing about Colorado’s teacher pension system (PERA), it becomes evident just how crazy the current system is. Here are the basic facts:
1. Members contribute 8.75 percent of their salary, which will rise to 10 percent next year;
2. School district employers contribute 20.40 percent of each teacher’s salary, rising to 20.90 percent next year;
3. The state assumes a 7.25 investment return (and has actually averaged 8.5 percent over the last 30 years).
If all you knew were these three variables, you could create a pretty awesome, cost-neutral retirement plan. Using the same contribution rates and investment returns, the table below shows how much a teacher who begins at age 25 would have saved at various ages. It essentially calculates the value a teacher could accumulate if her and her employer’s contributions were placed into a 401(k) and invested with the Colorado Public Employees’ Retirement Association’s (PERA’s) current asset managers (there’s nothing preventing the state from offering this option to teachers).
A 25-year-old teacher could have retirement savings worth…
At age 35:
$229,184
At age 50:
$1,2263,626
At age 60:
$2,950,023
These hypothetical results are quite outstanding. The teacher would become a millionaire by age 28, and she could make her second million if she continued teaching until age 56.
Colorado’s actual pension plan, however, provides a reasonably comfortable retirement only for the small fraction of people who remain teaching in the state for an entire career, but even that is not nearly as generous as this hypothetical 401(k). For example, a Colorado teacher with 10 years of service qualifies for only a minimal pension benefit, but an equivalent 401k consisting of her contributions, her employer’s contributions, and the interest earned on those contributions would be worth $200,000 more than her pension.
How is it possible that contributions plus interest are worth more than pension benefits? There are 17.5 billion reasons.
Instead of a straightforward retirement savings account based on contributions plus interest, Colorado has a complicated pension formula that relies on numerous assumptions about how fast investments will grow and how much teachers will earn in the future, how long they’ll remain as teachers, when and how long they’ll live in retirement, etc.
When those assumptions are wrong or the state doesn’t save enough for the future, it turns into a pension debt. That debt currently sits at $17.5 billion for schools. Colorado has responded by cutting benefits and increasing employee and employer contribution rates. (In 2010 it also went after the benefits of current retirees and reduced the amount their pensions could adjust to inflation. After a protracted legal battle, the Colorado Supreme Court declared it legal.)
Colorado leaders hope this situation is temporary and they can eventually lower the employer contribution rate, but history is not on their side. If stock markets continue their strong recent trend, Colorado may be able to drop the employer contributions back down a bit. But in the past, temporary respites have always been followed by higher contribution rates in future years.
In the meantime, teachers are forced to forego their own retirement savings in order to pay down a debt accrued over many years. It harms their future retirement security and, by forcing districts into painful budget decisions, it harms the quality of education delivered to Colorado’s students. Teachers would be better off in a different system.
Is Missouri's teacher retirement plan one of the best in the nation? That depends on who's asking.
Here's the perspective of one former Missouri teacher:
For this person, the Public School Retirement System of Missouri (PSRS) worked quite well. But does it work as well for other teachers? And did she "pay for" the benefit she's collecting? Let's run through the numbers. (I won't identify the individual by name, but her gender does matter for our calculations).
First, let's assume this person was earning about $55,000 when she retired, the average salary for experienced teachers across Missouri. Based on some assumptions* about how fast her salary might have grown, how much she would have contributed to the pension plan, and how well PSRS was able to invest the money and make it grow over time, I estimate the total value of the teacher's contributions comes out to about $360,000.
That figure doesn't include employer contributions. In Missouri, school districts match the employee's contributions toward the pension plan. So all in, the teacher and her employer contributed about $720,000 toward her pension.
Do the numbers work out? To find out, let's do some math on the value of her pension. Missouri allows a teacher to retire with 25 years of service at any age. They can begin collecting a pension benefit worth 2.2 percent times their final salary times their years of experience. (Missouri takes the employee's average salary over their final three years of service, but for simplicity's sake let's stick with the same salary figure as above.)
Her annual pension benefit is worth:
Annual Pension = 2.2 percent X 25 years X $55,000
Annual Pension = $30,250
Now, an annual income of $30,250 is not a lot of money. But this person chose to retire; perhaps she feels comfortbale living off that amount, or she's free to pursue another career if she wants to. Missouri pensions also include cost-of-living adjustments, so her pension will grow and keep up with inflation over time.
Also, note that this person gives her age as 46 years old. According to the Social Security's actuarial tables, a typical 46-year-old woman is expected to live another 36.9 years. That means we can expect her to collect a Missouri pension for another 37 years!
Once we account for her starting pension amount, the cost-of-living-adjustment, and her long life expectancy, this teacher's pension is worth more than $1.6 million. That's more than twice what she and her employers contributed toward the plan. Given these calculations, it makes sense that this teacher feels like "Missouri's Teacher Retirement System is one of the best in the world!"
To be fair, the individual teacher here did nothing wrong. She contributed exactly as she was told, she never missed a payment, and she took advantage of a promise the state made to her and her colleagues.
But she certainly did not "pay for" the benefit she's receiving. And her comments present a good case study of common misunderstandings about teacher pension plans.
First, older teachers retiring today are getting much better benefits than the next generation of teachers will. Like other states, Missouri enhanced their pension formulas multiple times in the 1990s, only to have to increase employee and employer contribution rates later in order to pay for them. This particular retiree will reap the benefits from the enhancemed formulas and she avoided having to pay the higher contribution rates for most of her career. On the other hand, new teachers in Missouri today will be worse off--they're more than paying for the mistakes of the past.
Second, most teachers in Missouri don't last as long as this person did. Maybe they don't like teaching as much as they thought they would, or life happens and they need to stop working, or they move to another state to be closer to family. Those people would all be better off in a more portable retirement system than the one PSRS offers, especially because Missouri has chosen not to enroll its teachers in Social Security. The majority of people who enter the teaching profession in Missouri will leave with inadequate retirement benefits.
Third, is this the highest and best use of educational resources? Today, the PSRS actuaries estimate the plan benefits are worth an average of 17.4 percent of each teacher's salary. Compare that to the fact that employees and their employers are each contributing 14.5 percent of the employee's salary, for a total of 29 percent, toward the pension plan. The difference between these two figures (29 percent minus 17.4 percent) is the amount needed to pay off PSRS' $7.4 billion in unfunded liabilites. Put another way, that's 10.6 percent of each teacher's salary that is going to pay off pension debts. If Missouri legislators had been more responsible in the past, that money could have been spent today on raising teacher salaries, buying new textbooks, expanding art or foreign language programs, or pretty much anything else.
A retirement system that was truly the "best in the country" wouldn't force these tough decisions. It would provide real retirement security to all of its members, not just 25-year veterans, and it would ensure that educational dollars were being spent on today's teachers and students, not past debts.
*Note: I'm using PSRS' assumptions for salary growth rates and investment returns, and I assumed PSRS' current 14.5 percent employee and employer contribution rates.
Taxonomy:Teacher pension costs in Maryland grew from 5.8 percent of the state’s K-12 education budget in the 2004-05 school year to 8.2 percent by 2017-18. In dollar terms, last year the state spent on average $1,149 per pupil on teacher retirement benefits, up from $542 in 2005 years ago. This problem is not unique to Maryland. Across the country teacher retirement benefit spending comprises a larger and larger share of education spending.
The growth in Maryland’s teacher pension spending far outpaced increases in the state’s overall K-12 spending. Between 2005 and 2018, the state increased general elementary and secondary education spending by about 50 percent, while pension spending more than doubled.
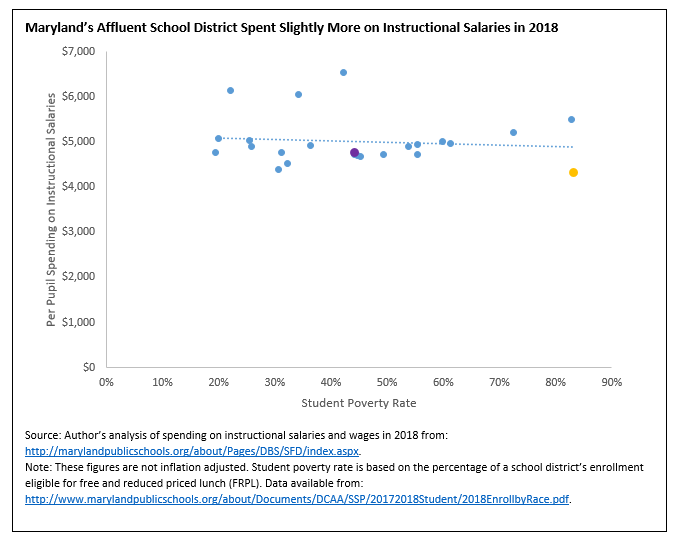
Spending on teacher salaries in Maryland is slightly regressive
The consequences of rising pension costs are not felt evenly across the state. Indeed, teacher pension spending actually increases inequities between high and low poverty districts in Maryland. This happens because pension wealth is a function of a teacher’s years of experience and salary, and school districts serving higher concentrations of students from low-income communities typically pay lower salaries and often have higher turnover. As a result, any gap in salaries across districts echo in a state’s pension spending.
As shown in the graph below, per pupil spending across Maryland’s 25 school districts is slightly regressive. In other words, more affluent school districts spend a bit more per pupil in instructional staff salaries. For example, Baltimore City spent (the yellow dot) on average $4,330 per pupil compared with $4,714 in the considerably wealthier district of Baltimore County (the purple dot).
In Maryland, the state operates only large, county-wide school districts, so it is likely that some school-level variation is diluted by the inclusion of so many schools – often from dissimilar communities – in a single district.
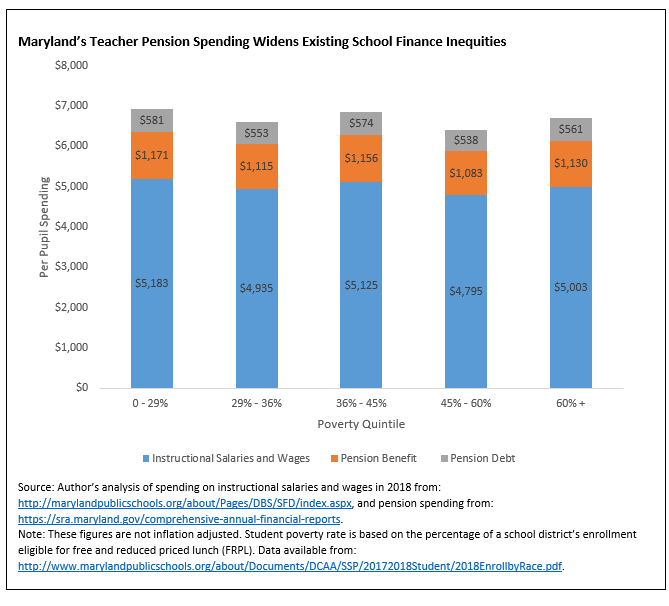
Pension spending exacerbates funding inequities between Maryland’s highest and lowest poverty districts.
Even though analyzing district-level data is limiting, the impact of pension spending across district inequities is nevertheless evident. In the graph below, I sorted Maryland’s districts into quintiles based on their student poverty rates. As shown below, pension spending exacerbates existing salary gaps.
Maryland’s school districts with the lowest concentration of student poverty serve 16.6 percent of the state’s total student enrollment and spend on average $5,183 per pupil in instructional salaries. The state’s districts with the most significant student poverty serve 26.4 percent of students in Maryland, but spend nearly $180 less than the most affluent districts. While that may not seem like a large gap, across a school of only 500 students, it leads to a $90,000 cumulative disparity – enough to pay for an additional veteran teacher, or perhaps two early-career support staff.
Since teacher pension spending is determined by a formula based in large part on salary, layering per pupil pension spending on top of the existing inequities leads to an even greater disparity. In terms of total compensation – salary and benefits – Maryland’s most affluent districts spend $6,935 per pupil, a gap of $241 per student as compared to schools with the highest poverty. Accounting for pension spending amplifies the total spending gap by 34 percent. In the same school enrolling 500 students, the total compensation gap amounts to a disparity of $120,500.
The additional inequities in school funding produced by teacher pension spending has been getting worse over time. This is partly driven by the rising debt costs of the Maryland teacher pension system. Failing to consistently meet the annual actuarially required contribution rates to keep up with pension obligations, falling short of investment return projections, or a combination of the two, increased the state’s unfunded liability. In response, the state increased its total contribution rate to keep pace with their pension commitments to retirees.
Maryland spends more on pension debt than it receives from the federal government to support low-income students
Maryland’s spending on teacher pension debt is based on a flat percentage across the state. Regardless of district, 11.21 percent of teacher salary in 2018 was spent to pay down the pension system’s debt. While there is some appeal in this approach, “charging” all districts equally ignores important differences across districts and can unintentionally create a greater burden on high-poverty districts. These districts typically have greater teacher turnover and a lower share of long-term veteran teachers who draw down the most valuable pensions in retirement. In other words, they’re accountable for a smaller share of the state’s total teacher pension debt.
Moreover, low income districts have a harder time generating revenue for their schools. This means that spending the same as affluent ones can actually consume a greater share of their total school funding. To illustrate this point, consider a $100 parking ticket. Every ticketed person owes the same amount of money to the city, but the financial burden of that citation is far less for a corporate lawyer than it is for a barista. In other words, equal cost can still produce inequitable results.
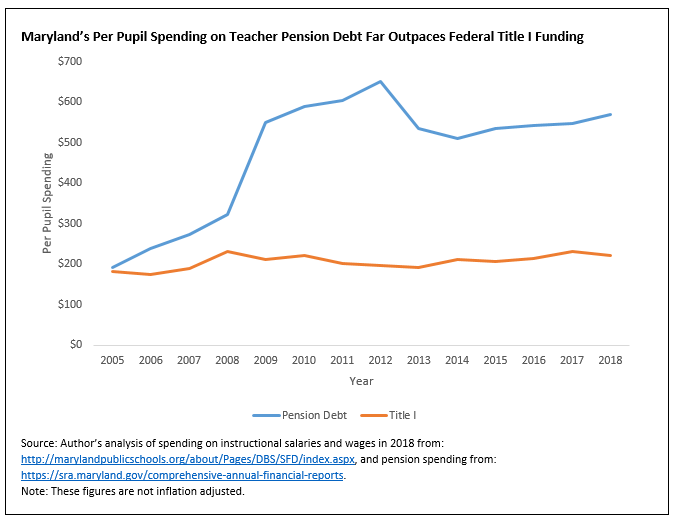
While spending on pension debt can actually create a greater financial burden for low-income districts, Title I of the Elementary and Secondary Education Act (ESEA) is structured to provide greater funding to districts serving the highest concentration of low-income students. The problem is that in Maryland spending per pupil on pension debt has far outgrown Title I funding, In other words, pension debt costs in the state are now so large that they overwhelm investments to support the education of the state’s low-income children.
As shown in the graph below, pension debt costs rose considerably, while Title I revenues remained flat. In 2005 the average per pupil debt cost of Maryland’s teacher pension fund was roughly comparable to Title I. But last year, Maryland on average spent $570 per pupil on pension debt while receiving only $221 in Title I. Put another way, federal investments in education to mitigate the adverse effects of concentrated student poverty amount to less than half of what to the state is paying toward its own teacher pension debts.
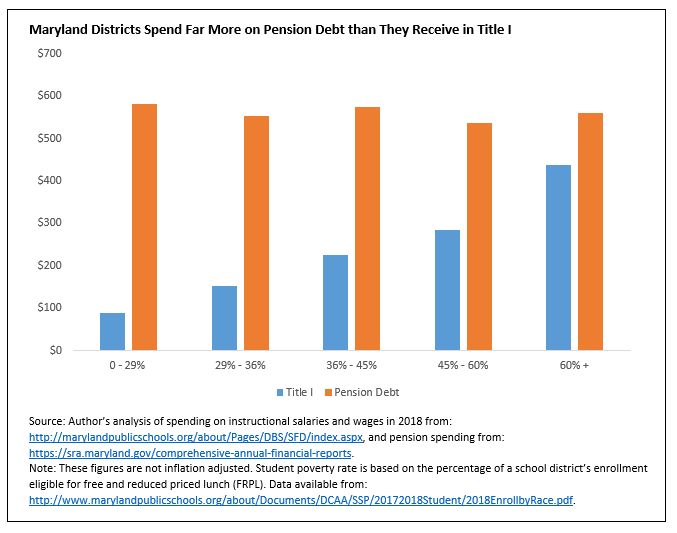
Not every district receives the same amount of Title I dollars per pupil. This is because the federal government allocates these funds somewhat progressively, with higher poverty districts receiving greater support per pupil than more affluent ones. The idea is to provide greater financial support to students who attend high-poverty schools and typically face more significant challenges. Pension debt, however, undermine that effort. As shown below, pension debt costs are far greater than the amount of Title I per pupil funding a district receives. Even in Maryland’s highest poverty districts, average pension costs are significantly greater than average Title I funding. As a result, the state’s pension spending blunts the effect of federal education spending designed to provide greater support to high-poverty school districts. If Maryland were to improve the financial health of its teacher pension system, students attending high-poverty districts would receive greater per pupil funding overall even if the state didn’t increase the equity of its own school funding system.
The graph above makes clear that pension debt costs are greater than Title I revenues in Maryland school districts. However, it would be a mistake to interpret these data to suggest that despite considerable pension costs, high-poverty districts nevertheless receive greater funding due to the progressivity of Title I’s allocation formulas. There are two key problems with that interpretation.
First, there are Title I fiscal requirements designed to ensure that federal funds are layered on top of state and local funding that are already at least equal among high and low poverty schools. In other words, using federal funds to make up for inequities in state or local funding is in violation of the federal law. Unfortunately, Maryland and many other states fall short of that minimum standard.
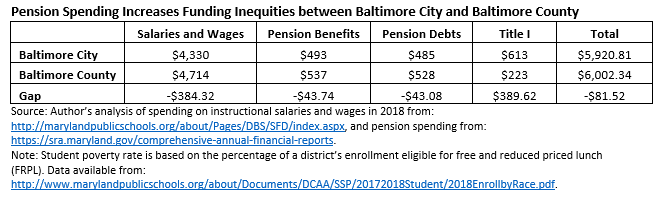
The second issue is that even the inclusion of Title I funds can be insufficient to overcome spending gaps between high- and low-poverty districts. Consider Baltimore City and Baltimore County. The city has an 83 percent student poverty rate, while the county has a poverty rate of 44 percent. The large difference in the concentration of poverty between the districts results in a wide gap in Title I funding. However, as shown in the table below, receiving nearly three times as much Title I funding per pupil still does not overcome the salary and pension spending inequities.
The total salary and benefits gap between Baltimore City and County, excluding Title I, is $471 per pupil. Pension spending increases the salary-based disparity by 23 percent. Layering Title I on top of that funding context, even with Baltimore City receiving so much more per pupil, is not enough to overcome the existing inequity.
In Maryland, teacher pension spending is yet another way that fewer dollars are spent to educate students from low-income backgrounds than are spent on affluent students. And while teacher retirement is not typically at the forefront of school finance equity debates, pensions represent a considerable and growing education expense that often exacerbates existing inequities.
What can be done?
To mitigate the adverse effect pension spending has on school funding equity would require significant reforms, such as creating greater pay teacher pay equity among districts; and, more evenly distributing higher-paid, experienced teachers across the state rather than concentrating them in suburban and lower-poverty areas.
But those are long-term goals. For a shorter-term project, Maryland should focus on getting its rising debt costs under control. One strategy is to lower the assumed rate of return on the investment of the pension funds. When Maryland misses the mark, even by a fraction of a percent, the consequences for the state’s education system’s funding can be significant since they’re investing tens of billions of dollars. When this happens Maryland’s plan’s debt increases since there are fewer aggregate dollars in the fund.
Although decreasing the assumed rate of return will help the health of Maryland’s state teacher pension fund over the long-term, it will have the short term effect of rising pension costs and exacerbating inequities. To mitigate this consequence, Maryland could shift the burden of pension debt costs to the state entirely rather than as an effective tax of teachers’ labor at the district level. Taking this approach won’t solve the problem immediately, but it will help Maryland reduce its teacher pension debt overtime.
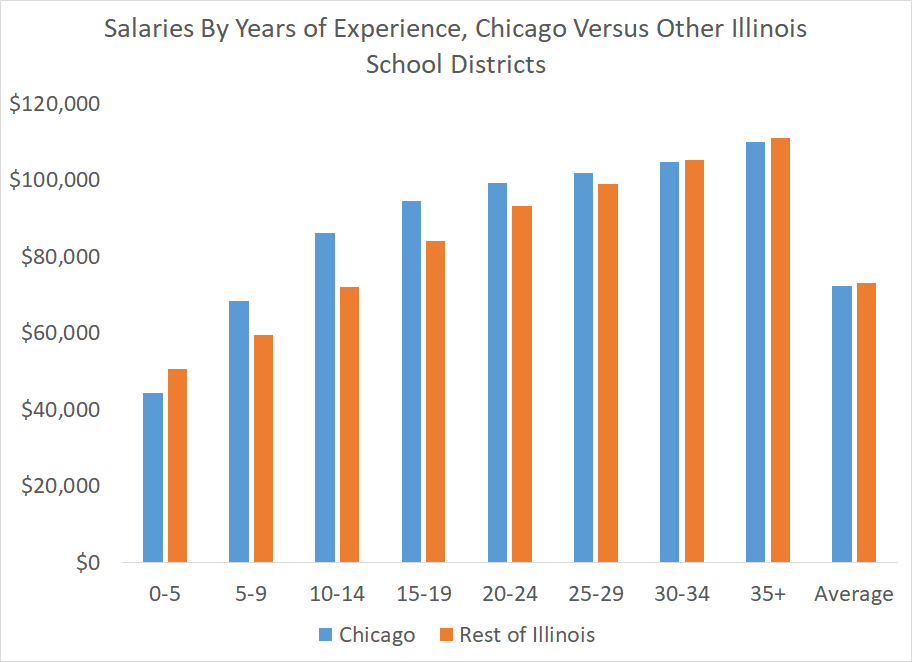
- Earlier this month, Chicago Mayor Lori Lightfoot said, "Teachers in Chicago Public Schools are paid some of the highest compensation of any school system in the country." Politifact Illinois rated this claim as "mostly false," but I think they missed a few key elements*. If I were rating it, I'd call Lightfoot's claim "mostly true." Let me explain why.According to NCTQ, Chicago's starting teacher salary ranks 22nd out of 124 large school districts, and near the top for teachers with more years of experience and higher degrees. Because large school districts tend to pay higher salaries than most school districts other than suburban ones, it's reasonable to conclude that Chicago teacher salaries are some of the highest in the counry.However, those findings only look at salaries, not the total compensation claim that Lightfoot was making. Due to the fact that Chicago pays much higher pension costs compared to the rest of Illinois (and to districts in other states), I would have agreed with the Mayor's statement that Chicago's total teacher compensation is much higher than other places.Let me walk you through some numbers to show what I mean. I pulled data directly from the Chicago city and Illinois state teacher pension funds. For all members in each plan (including teachers and other educators), the pension plans report data on average salaries by experience level. According to their respective pension plans, Chicago has lower starting salaries than other educators across the state of Illinois, but for all educators between five and 29 years of experience, Chicago pays higher salaries.
 From the pension plans, we also know how many educators fall into each of these experience categories. About 77 percent of all Chicago educators fall under the higher-paid experience bands. The majority of Chicago educators are earning salaries that are 3-16 percent higher than educators in the rest of the state of Illinois.But that's just salaries and does not include pension costs. Due to the fact that Chicago pays for its own pension plan while the rest of the state does not, Chicago as a district is paying MUCH higher pension costs. After a budget compromise in 2017, Chicago is still paying 27 percent of each teacher's salary toward the city pension fund, whereas the rest of Illinois' school districts are paying just 0.68 percent toward the state pension fund. That is an enormous disparity. (This is solely about the employer costs of pensions, but Chicago also "picks up" 7 percent of the employee's pension contribution, which is another area where Chicago is a bit of an outlier in Illinois, and certainly compared to districts in other states.) Once you factor in these pension disparities, Chicago has much higher compensation costs for educators at every level of experience.The graph below combines the salary differences and the pension disparities. As the graphic shows, depending on the employee's years of experience, Chicago is paying 10-34 percent higher compensation costs compared with educators in the rest of the state. Illinois ranks as one of the higher-paid states in terms of salaries, and Chicago's pension costs some of the highest in the country.
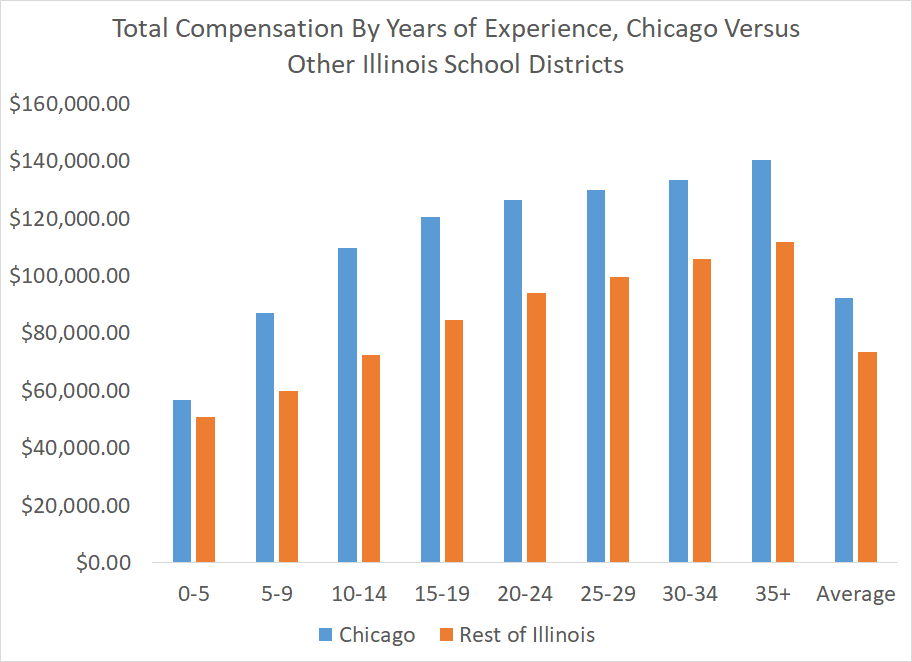 It's possible there are still some a few suburban districts in Illinois paying higher teacher compensation than Chicago. But those would be rare and far between once you factor in the much-higher pension costs that Chicago is paying. The data here are not adjusted for cost of living, do not include health care costs, and they include all education employees, not just teachers, but I would still classify Chicago as having higher compensation costs than almost all other school districts.*Disclosure: I spoke with Politifact Illinois reporter Kiannah Sepeda-Miller about the article, mainly about one particular pension angle called "pension pickups," but I didn't know the full claim she was investigating and would have come to different conclusions than she did.Taxonomy:
 Teacher salaries differ – sometimes significantly – from school district to school district. And as I’ve written previously, differences in salaries are exacerbated by state pension funds. Districts serving high concentrations of low-income students often pay teachers lower salaries than other districts and also end up spending far less on teacher retirement as well.
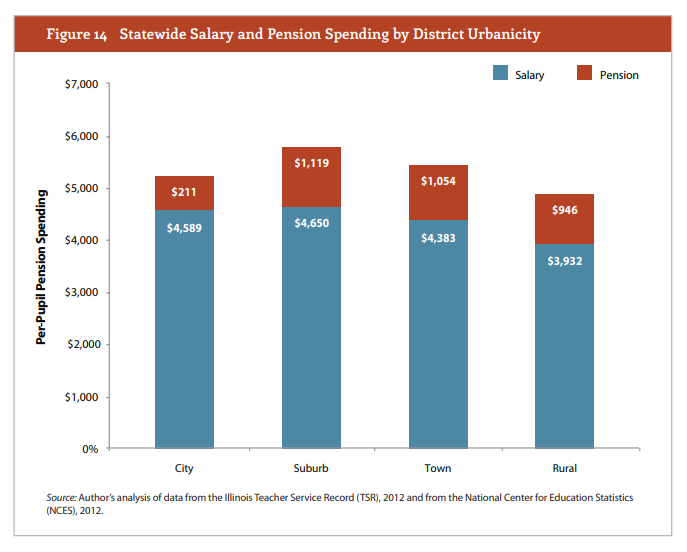
In an analysis of Illinois teacher pay data, I found that this problem is particularly pronounced in rural and urban school districts. However, the reasons for the pay disparities differ between rural and urban districts. Rural districts have lower average salaries and thus less valuable pensions. Urban districts offer salaries comparable with the suburbs, but have a greater share of educators who do not qualify for benefits in the system, and a greater share of educators with fewer years of experience overall, which also results in lower pension benefits.
As shown in the graph below, rural districts in Illinois spend the least per pupil on salaries, while urban districts spend far and away the least per pupil on pensions. As a result, the aggregate disparity with suburban districts actually increases for both rural and urban districts. Once you factor in pensions, the rural-suburban gap increases by $173 per pupil, or 24 percent. Urban districts spend only $61 less per pupil in salaries than suburban districts. However, after accounting for pension spending, that gap increases to $969 per student.
Rural and suburban districts earn roughly the same percentage of salary in pensions. Nevertheless, since rural districts spend far less per student in salaries, the spending gap grows after accounting for pension spending. So the problem for rural districts is simply that they do not, or cannot afford to, pay teacher salaries comparable to what suburban districts do.
The problem is different in Illinois’ urban districts. On average cities pay about the same as suburban districts. That said, their pension spending per pupil is significantly lower than suburban districts. This is principally due to two things. First, Chicago operates its own pension fund, which is in an even worse financial situation than the state pension fund. In the final year of this analysis, the Chicago Teacher Pension Fund contributed only 6.24 percent of salary to the fund compared with 24.06 percent across the rest of the state. The experience of Chicago teachers greatly contributed to the lower pension spending. The good news is that this problem is somewhat ameliorated by a recent law requiring the state to contribute more to help cover Chicago’s teacher pension costs.
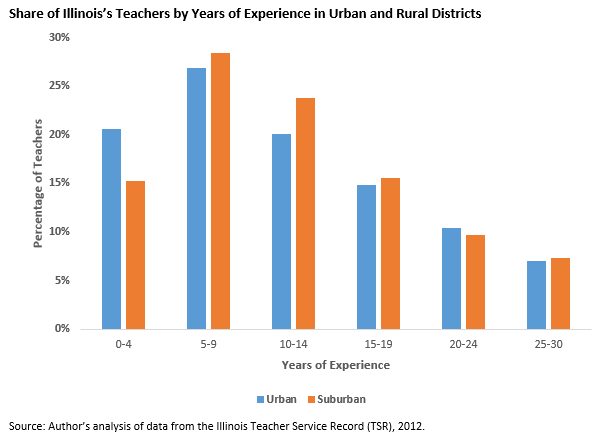
The second reason is urban districts employ a higher concentration of younger teachers. Indeed, 5 percent more teachers in suburban districts reach the 5 years of service required to vest into the system and quality for a pension. And for those educators hired after 2011, the vesting period is 10 years. Even fewer teachers will reach that mark. As shown in the graph below, urban districts have a higher concentration of inexperienced teachers. Indeed, suburban districts employ a greater share of mid-career and long-term educators. Since pension spending is determined by formula and is based on salary and years of experience, a disparity in either variable will produce a disparity in pensions.
The structure of state teacher retirement systems produces the unintended consequence of exacerbating existing inequities between school districts. And while teacher pension spending is a particular kind of school spending, it nevertheless is yet another disadvantage facing districts that already have fewer resources.
It is understandable that districts with a greater capacity to offer higher salaries will do so. It would help close funding inequities if states provided greater financial support to high-poverty districts. Yet, unless that results in salary equity, the pension system will contribute to spending disparities. There are no easy solutions to this problem, but states should look for ways to provide teacher retirement benefits that avoid compounding existing inequities.
The following is a guest piece from Carrie Hahnel, on behalf of The Opportunity Institute. Carrie thanks Guy Johnson, Christopher Edley, and Chad Aldeman for their guidance and input. Follow Carrie on Twitter at @CarrieHahnel.
Introduction
When California passed the Local Control Funding Formula in 2013, it represented a political consensus that state education aid should be distributed based on student needs,[1] and that a primary role of state funding is to mitigate the impact of locally-based funding inequities. These are fairly uncontroversial positions, and represent a principled approach to equity that is mirrored in the way federal education funds are spread across districts and schools. State and federal policies that level the playing field are essential because young people affected by poverty, segregation, discrimination, and trauma often have greater educational needs. Without some kind of counterbalance, history tells us that local policies and funding too often exacerbate inequities.
Yet when it comes to teacher pensions--a significant form of state spending on education, and a major part of the education budget--this equity principle is rarely discussed.
The Opportunity Institute urges this to change, since equity is its main concern. This concern is anchored in the belief that Americans ought to have a shared interest in public investments that support the success of each and every child. In considering pension equity, the Opportunity Institute starts from the premise that we can: (1) honor the wage and retirement-related promises we have made to our teachers, staff, and school leaders, and (2) provide timely and sorely-needed services to those students in greatest need.
Pension spending as a form of state investment is particularly salient in California, because the state – not just employees and their employers – contributes to the California State Teachers’ Retirement System (CalSTRS). This makes CalSTRS somewhat unique among teacher pension programs. The state of California alone will pay $4.4 billion into the teacher pension fund in 2019-20, which is about 6 percent of total K-12 spending and more than $700 per student. That is on top of the roughly $1,280 per student that districts will spend on teacher pensions this year.[2]
Policy makers and the public should demand to know who is reaping the greatest share of the benefits from that investment. Do teachers and students in our neediest communities benefit more than their counterparts in wealthier areas? Our analysis suggests they do not. At best, the current system is approaching an equal distribution of dollars, with wealthier districts benefiting somewhat more from this state investment than poorer districts. It is a far cry from equity.
Teachers in all parts of our state deserve good retirement benefits--this is good for the profession and good for students. At the same time, equity advocates should ask whether the state should be boosting wealthy communities’ total compensation, particularly when it comes at a real cost to less well-off districts.
Background
Most public school teachers in California are paid according to locally bargained salary schedules and receive locally determined health and welfare benefits. California teachers do not participate in Social Security, so they rightly expect their pensions to provide reasonable retirement security. Most are eligible to receive a state pension and participate in the California State Teachers’ Retirement System (CalSTRS). This is funded by contributions from employees, districts, and the state. The benefit itself is determined by a teachers’ years of service and final salary, with many of these benefits backloaded. A new teacher starting out today who works 32 years in the CalSTRS system could retire at age 62 with annual retirement benefits equivalent to about 64 percent of his or her final salary.[3]
Unfunded liabilities
The cost of teacher pensions in California is rising, but not necessarily because teachers are getting paid more or because their benefits are improving (aside from annual inflation adjustments). Instead, costs are on the rise because investment returns have not kept up with projected returns, people are living longer, and the number of workers contributing to the system is lower than the number who are drawing on it. These factors and others have contributed to a massive unfunded liability. As of June 2017, the unfunded liability of the California State Teachers’ Retirement System (CalSTRS) – the amount it will owe to teacher retirees over the next 30 years but hasn’t yet funded – stood at $107 billion.[4] That’s about the GDP of Ecuador, or enough to cover University of California tuition, fees, and living expenses for more than 20,000 students per year for the next 30 years.
Rising contribution rates
To chip away at this liability, the legislature has been gradually increasing state and district contribution rates. In 2019-20, school districts will pay 17.1% of a certificated staff member’s salary, the state will pay 10.3%, and employees will pay 10.3%. In total, 37.7% of each teacher’s salary will be paid into the pension fund this year. By comparison, Social Security collects 6.2% each from employees and employers, for a total contribution rate of 12.4%.
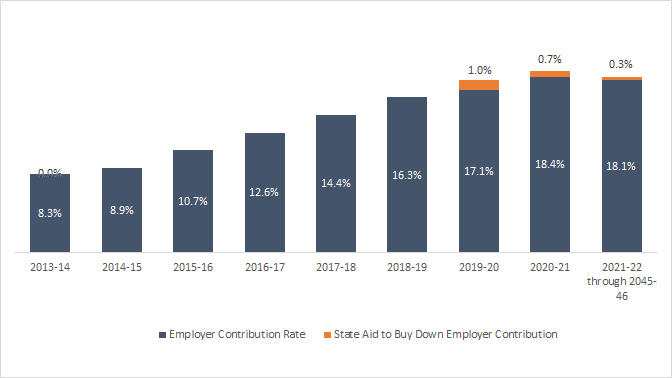
This contribution is expensive for cash-strapped school districts, but it could have been worse. Rates were expected to rise to 18.1% this year and 19.1% next year, as required by Assembly Bill (AB) 1469, signed into law by Governor Brown in 2014. Recognizing the fiscal strain this has placed on school districts, Governor Newsom’s 2019-20 budget invests $850 million over the next two years to buy down the CalSTRS and CalPERS contribution rates and offer districts some short-term relief. (See Figure 1.) In addition, the budget includes $2.3 billion in supplemental payments to the pension fund to decrease districts’ share of the long-term liability. These two moves are expected to save districts approximately $6.1 billion over the next three decades. Finally, the budget also included $3.6 billion in supplemental payments to decrease the state’s share of the liability.[5]
Figure 1: Employer CalSTRS contribution rates have risen sharply under AB 1469, but the state is buying down these rates over the next two years
State Pension Aid Disproportionately Benefits Wealthy Communities
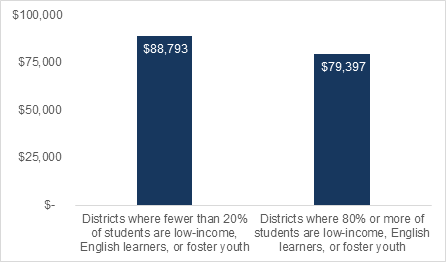
Since pension benefits are a function of a teacher’s salary at the time of retirement, higher paid teachers will draw down more in pension benefits than lower paid teachers. Therefore, districts that can pay teachers more will draw more state pension aid on behalf of their employees than lower paying districts.
Districts with higher teacher salaries tend to be those serving fewer low-income, English learner, and foster youth students—a category the state calls “unduplicated” under LCFF, but that we will call “high need” for simplicity’s sake. This is demonstrated by Figure 2, which compares teacher salaries in high and low-need districts.
Figure 2: On average, teachers in low-need California school districts receive nearly $9,000 more in annual salary than teachers in high-need districts
Source: Analysis of 2017-18 J-90 data, in combination with the percentage of students who are unduplicated low-income, English learners, or foster youth, as reported by the California Department of Education
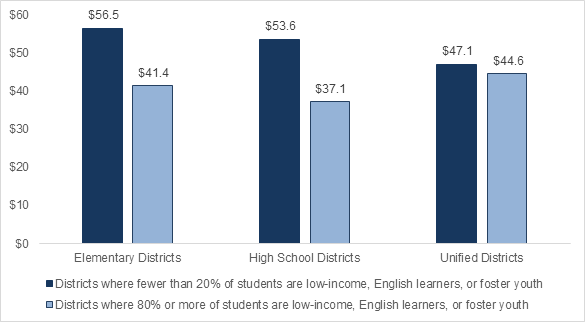
Using teacher salary data, we estimated how much of a benefit different districts were likely to receive from Governor Newsom’s $850 million pension aid package. Specifically, we estimated how much the first-year rate-buy down would save each district. On average, elementary, high school, and unified districts will save $43 per student. The differences between districts based on student need are not extreme, but they are regressive. That is, less-needy districts – those with fewer low-income, English learner, and foster youth students – will receive more of a benefit since their teachers have higher salaries. (See Figure 3.)
Figure 3: Lowering the CalSTRS contribution rate from 18.1% to 17.1% will save districts $43 per student, and low-need districts will fare slightly better than high-need districts
This analysis looked at only the $850 million rate buy-down, not the additional $2.3 billion Gov. Newsom has put into reducing districts' long-term liabilities. But the calculus is essentially the same - state aid that is distributed as a function of teacher salaries will lead to regressive investments. For instance, we estimated that in 2017-18, the state contributed $510 per student in pension aid on behalf of low-need elementary districts, but only $402 per student in high-need elementary districts. That’s a gap of $108 in pension spending.
If we were to look at school-level rather than district-level spending, the gap would probably be even larger because schools in wealthier neighborhoods often have higher paid teachers. Indeed, a 2017 analysis of Illinois pension spending data found that the state contributes $566 more per student in the wealthiest schools than in the poorest.[6]
Undercutting the Promise of LCFF
The promise of LCFF was that higher-need students would benefit from greater resources that would be used to level the playing field. And to be sure, the state is now directing more funding to education than ever before, and it is spending more equitably than in the past.[7] But unfortunately, regressive policies that direct a disproportionate share of money to wealthier communities—whether intentionally or not—cut against that promise. It’s not just this pension aid package, which is only modestly inequitable. It is also the fact that wealthier communities already have the means to raise more money for schools. Wealthier communities are already more likely to:
- Pass parcel taxes. In 2017-18, 113 districts had parcel taxes. The average district that approved a parcel tax was only 32 percent free or reduced-price lunch and generated an average of $1,080 per student.
- Raise facilities funding through bonds. Districts with greater property wealth raise significantly more money through local revenue bonds; state modernization funds also disproportionately benefit wealthier districts.[8]
- Generate local revenues through donations, PTAs, and other sources. Some districts, including Piedmont City Unified, Portola Valley Elementary, Hillsborough City Elementary, Orinda Union Elementary, San Marino Unified, and others report that they raise more than $1,500 per student from local sources. This is only the amount reported and does not include all financial or in-kind donations. These local revenues can be used for many things, but they often help to improve existing services by reducing class sizes or helping to buy additional programs like art, music, gardening, or field trips.
Regardless of whether communities have a robust local tax base, wealthy residents, and/or parents who are simply able to contribute more to their local schools, the result is that these districts can independently invest more in facilities, teacher salaries, and other programs and services than can lower-wealth districts. When the state distributes state aid on top of this in an equal or regressive fashion, it exacerbates inequities.
A tale of two districts
To illustrate how these differences stack up, let’s take a look at two school districts in San Mateo County on the San Francisco Peninsula. Redwood City Elementary and Menlo Park City Elementary share a boundary, with Redwood City spanning a larger, less wealthy, and more diverse area to the north, and Menlo Park covering a smaller, higher-income, and more white area to the south, just a few miles from Stanford University. Both communities are home to many tech giants and skyrocketing home prices.
Figure 4: Two neighboring districts illustrate large funding disparities
Redwood City
Elem.
Menlo Park City
Elem.
Students qualifying for free/reduced-price meals
51%
9%
Students who are non-white
80%
50%
Median household income[9]
$86,000
$156,000
Parcel tax dollars per student[10]
$230
$2,800
Other local revenues per student[11]
$780
$1,600
Total per-pupil spending[12]
$12,834
$16,583
Average teacher salary[13]
$78,000
$107,000
Both districts have been successful in passing parcel taxes, although Menlo Park has four separate taxes that stack up to $1,089 per parcel, while Redwood City tried multiple times to levy a parcel tax before finally passing a modest $85 per-parcel tax in 2012. Menlo Park’s four parcel taxes bring in about $2,812 per student each year, while Redwood City’s parcel tax brings in just $233 per student.
Menlo Park reports other local revenues of $1,884 per student, while Redwood City reports $841.These and other differences in local fundraising stack up. Despite the extra bump Redwood City gets from LCFF, it spends $12,834 per student each year, significantly less than Menlo Park’s $16,583 per student. As a result, Redwood City has less to spend on major expenses such as teacher salaries. The average teacher salary in Menlo Park is $107,000 while the average teacher salary in Redwood City is $78,000.
Under Governor Newsom’s pension rate buy-down, Menlo Park will save about $71 per pupil while Redwood City will save about $39 per student. In total, the state annually pays about $770 per pupil in pension aid on behalf of Menlo Park but only $423 per pupil on behalf of Redwood City.
What Can the State Do?
At a time when rising pension and benefit costs are squeezing school district budgets and leading to painful reductions in student services,[14] the state should be seeking every opportunity to ease the burden on school districts through equity-centered policies, not regressive approaches that exacerbate inequities.
To the extent the state is going to contribute more general fund dollars to schools, it should first prioritize the needs of communities that are under-resourced or marginalized. Researchers, policy makers, policy advocates, and community leaders should come together to propose viable solutions—but here are a few ideas to start.
- Fold state aid otherwise intended for immediate district pension relief into LCFF, so it is distributed equitably. The pension contribution rates would remain high, but districts could engage with their local communities to make decisions about how to best use their funds. There is certainly the risk that any “new” dollars would be sunk into across-the-board salary increases (which will also ratchet up pension costs), especially in districts with strong unions. The state would have to safeguard against this, potentially by finally and firmly constraining the use of LCFF supplemental and concentration grants, among other strategies.
- During years of strong economic growth, prioritize paying down the unfunded liability over offering relief directly to school districts. As the Legislative Analyst’s Office has pointed out,[15] this will benefit communities in the long run since it will accelerate progress toward a fully funded pension system. Prioritize district relief during economic downturns, when low-income students, English learners, and other vulnerable populations inevitably suffer from reductions in services.
- Rather than limit the ability of districts to raise money locally, find ways to capture and redistribute some of that funding. For example, require that a portion of local donations, such as parent contributions, be redistributed to poorer schools, or offer greater tax deductions for donations made in poorer school districts. Explore state measures that will expand local tax authority while building in safeguards to recapture, redistribute, and backfill funds to less wealthy communities.
- Consider hybrid plans that mix traditional pension benefits with quickly vesting, portable defined contributions. These plans could guarantee teachers retirement security while also allowing for mobility - which could be attractive to younger teachers. These types of plans could also help reduce state liabilities in the long run, which would free up more dollars to invest in schools through LCFF. Virginia, Tennessee, and Rhode Island have hybrid plans that may offer lessons learned.
- Incentivize or encourage districts to create differentiated pay opportunities for teachers working with high-need populations, such as special education students or English learners, or in schools with high concentrations of poverty. This would result in higher salaries in higher need communities and would ensure that local and state pension aid is more equitably distributed.
No doubt there are opportunities to refine these ideas and introduce new ones. The overriding goal would be to ensure that any state investments in education--pension payments included--are steered by principles of fairness and equity.
______________________________________________________________[1] The Local Control Funding Formula provides every district with a base funding amount and additional funding based on the percentage and proportion of students who are low-income, English learners, or foster youth.
[2] Based on my own analysis using California Department of Education 2017-18 expenditure data and projecting ahead using new pension contribution rates.
[3] Benefits vary depending on several factors, including age of retirement and years of services. Teachers who began teaching in 2012 are eligible to enjoy slightly better benefits under the “CalSTRS 2% at 60” structure, while teachers who began in 2013 or later fall under the “CalSTRS 2% at 62” structure. See the CalSTRS member handbook for more details.
[4] Defined Benefit Program of the California State Teachers’ Retirement System, June 30, 2018 Actuarial Valuation, Milliman, Inc.
[5] https://lao.ca.gov/Publications/Report/4083 and http://www.ebudget.ca.gov/2019-20/pdf/Enacted/BudgetSummary/K-12Education.pdf
[6] Max Marchitello, “Illinois' Teacher Pension Plans Deepen School Funding Inequities,” 2017: https://www.teacherpensions.org/resource/illinois-teacher-pension-plans-deepen-school-funding-inequities
[7] Rucker Johnson, Paul Bruno, Sean Tanner, “Effects of the Local Control Funding Formula on Revenues, Expenditures, and Student Outcomes,” part of the Getting Down to Facts II project, Stanford University, Sept. 2018; Theresa Chen and Carrie Hahnel, “The Steep Road to Resource Equity in California Education,” The Education Trust - West, 2017.
[8] Eric Brunner, Jeffrey M. Vincent, “Financing School Facilities in California: A 10-Year Perspective,” part of the Getting Down to Facts II project, Stanford University, Sept. 2018.
[9] Household income and race data are from Ed-Build: https://edbuild.org/content/dividing-lines/main.
[10] Parcel tax revenues from Ed-Data.
[11] Ed-Data 2017-18 General Fund Revenues. Other local revenues exclude parcel tax revenues.
[12] Ed-Data 2017-18 Current Expense of Education per ADA (per Education Code Section 41372).
[13] Analysis of 2017-18 J-90 data.
[14] Hannah Melnicoe, Carrie Hahnel, Dr. Cory Koedel, and Arun Ramanathan, “The Big Squeeze: How Unfunded Pension Costs Threaten Educational Equity,” Pivot Learning, Oakland, CA, 2019.
[15] Legislative Analyst’s Office K-14 Pension Rate Relief Proposals Handout: https://lao.ca.gov/handouts/Conf_Comm/2019/K-14-Pension-Proposals-053019.pdf.