
Here at TeacherPensions.org, we know pensions can be complicated. Thanks to teachers and their family members finding our site as they search for information about how pension rules affect them, 2019 was another banner year for our traffic figures. We aim to help teachers understand how their benefits work through simple, clear explanations.
As we look back on 2019, pensions and other employee benefits continued to eat into teacher salaries, and new research documented the ways pensions affect teachers, schools, and students. To recap the year in pension analysis, here's a list of our most popular work from 2019:
10. How Teacher Pensions Exacerbate Inequities in Rural and Urban School Districts: Pension plan benefit formulas typically depend on two main variables--salary and years of experience. Teacher pension plans in particular tend multiply those variables to determine benefits for all educators across an entire state, but teachers and school district resources are not equitably distributed across states. This piece found that rural districts, with lower salaries, and urban districts, with higher staff turnover, receieve lower pension benefits compared to educators in suburban schools.
9. Technically Speaking, Ohio School Districts Don't Contribute to Ohio Teacher Pension Benefits: In Ohio, school districts are contributing 14 percent of each teacher's salary toward the state pension plan. However, all of that money is going to pay down the pension plan's unfunded liabilities. In fact, a portion of Ohio teachers' own contributions are also being spent on the pension plan's unfunded liabilities. Crazy as it may sound, the average Ohio teacher is getting back less from the pension plan than they themselves are putting into it.
8. For Most Teachers, Vesting Periods Don't Matter: Under most retirement plans, employees begin to qualify for employer-provided retirement benefits once they reach the plan's vesting period. But under pension plans, like those offered to most teachers, merely qualifying for a pension does not necessarily translate into much of a benefit, particularly for younger workers. For teachers who begin their careers before age 45 or 50, vesting won't matter at all; they may even be better off withdrawing their funds immediately than waiting to collect a benefit when they retire.
7. Insufficient: How State Pension Plans Leave Teachers With Inadequate Retirement Savings: In the retirement world, it's common to hear people assume that workers who are covered by a pension plan are better off than workers with other types of retirement plans. That perception is doubly true for teacher pension plans. But in this piece, we found that a new, young teacher in a typical state would have to stay for 28 years before qualifying for an "adequate" retirement benefit. Teachers who fall short will have to work longer, save more in their personal accounts, or rely on other forms of income in their retirement years. There are cost-neutral plan design options that would put all teachers on a path to a secure retirement.
6. New Actuarial Study: Good News for Teachers, but With a Price Tag for States: Teachers are living longer, and the average retired teacher can expect to live to 88 or 90 years old, depending on their gender. While these new actuarial findings may come as good news for teachers and their family members, they do come with a cost for state pension plans.
5. California's Hidden Pension Gap: State Spending on Teacher Pensions Exacerbates School District Inequities: As with the #10 story highlighted above, this piece found that wealthier school districts in California benefited slightly more from the state's investments in teacher pensions than poorer districts did. Less-needy districts – those with fewer low-income, English learner, and foster youth students – benefit more because their teachers have higher salaries.
4. Teacher Pension Plans: How They Work, and How They Affect Recruitment, Retention, and Equity: In this easy-to-read PowerPoint slide deck, we look at the history of teacher pension plans and how they interact with key education issues facing our schools today, including attracting and retaining high-quality teachers and providing equitable resources for disadvantaged students.
3. Social Security, Teacher Pensions, and the “Qualified” Retirement Plan Test: In 15 states and the District of Columbia, public school teachers do not participate in Social Security. While working in those states, teachers neither contribute nor earn benefits toward the nationally portable, progressive benefit structure that many Americans depend on. Although there are federal rules designed to protect those workers, we find that those rules fail to protect many short- and medium-term workers who leave their service with only minimal retirement benefits.
2. Update: What is the Average Teacher Pension in My State?: In 2019, we updated one of our most popular pieces of all time--a 2016 post looking at the "average" teacher pension in each state. In the new version, we updated the state figures, provided additional context, and added new features to improve the user experience. Although knowing the “average" pension in each state can be interesting, we caution that it may not reflect the amounts many teachers actually earn.
1. At What Age Do Teachers Start Teaching?: Our most popular post of 2019 provides data on the average age teachers begin their careers in each state. While a teacher's age may not affect their teaching ability, age is an important factor when it comes to calculating teacher pension benefits. Because teacher pension formulas are based on a teacher's salary in the last year they taught, regardless of when that took place, pensions offer greater rewards for late-career service than than they do for the same years performed earlier in the teacher's career. From a policy standpoint, it may not make a whole lot of sense to prioritize some teachers over others. But that's exactly what teacher pensions do.
Taxonomy:The Wall Street Journal has an important story up this month by reporters Anne Tergesen and Gretchen Morgenson on how unions receive kickbacks from companies peddling high-fee 403(b) accounts to teachers. Here's just one story:
Teacher David Hamblen said a recommendation by the National Education Association was a key reason he put 403(b) savings in an annuity before his 2010 retirement from the El Dorado Union High School District in Placerville, Calif.
The NEA is the nation’s largest teachers union, with some three million members. “I thought that if they were recommending it, it must be a very good product,” Mr. Hamblen said.
Around 2007, he read an article that mentioned payments an NEA affiliate received from an insurance company. With another public-schools employee, he sued the union, as well as insurance company Security Benefit Corp. and others. The suit, filed in federal court in the Western District of Washington in Tacoma, alleged that 403(b) participants were harmed by an arrangement in which the NEA and an affiliate endorsed high-cost investments from providers....
Mr. Hamblen in California lost his lawsuit challenging the NEA subsidiary’s deal with investment providers. A federal appeals court said the union and its subsidiary didn’t have a fiduciary obligation to make sure that fees on retirement-plan products were reasonable. Generally, public-school teachers’ 403(b) plans are exempt from federal pension law requiring 401(k)-plan sponsors to act in participants’ best interests.
Although teachers should consult with their own financial advisors before making any decisions, they can check out the nonprofit website 403(b)wise for more personal stories like this one, plus suggestions on how to get out of a bad 403(b) or avoid getting into one in the first place.
Taxonomy:In 2018, I warned that Colorado was on the verge of cutting teacher retirement benefits. Earlier this month, Colorado's Public Employee's Retirement Association (PERA) did just that.
Under the provisions of a 2018 law, PERA has the authority to raise employee contribution rates when the pension fund needs it. That legislation also extended a generous, portable retirement plan called PERA-DC as an option to almost all state and local government employees.
To everyone except teachers, that is. As I wrote at the time, this defined contribution plan would have been better for the vast majority of Colorado teachers. But no. The state’s teachers unions fought to preserve the existing defined benefit pension system and adamantly opposed giving teachers a choice over their retirement. As a result, all teachers are stuck facing higher contribution rates and lower cost-of-living adjustments, and teachers hired after 2020 will get an even worse pension plan.
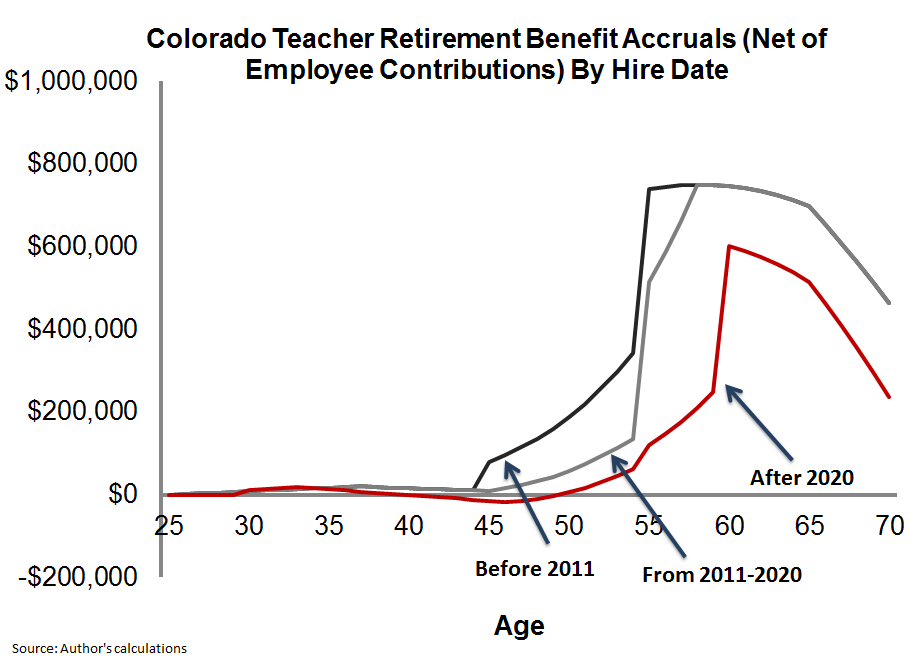
This is not a new trend. Colorado has been raising contribution rates and cutting teacher retirement benefits since 2005. By 2020, they will essentially have six tiers of benefits based on when the employee started their service. Five of those tiers were created since 2005, and each tier is worse than the one that came before it.
To show what this looks like, consider the graph below. It shows how a teacher’s pension value increases over time, net of their own contributions, depending on when they begin their employment. For simplicity’s sake, I’ve condensed the benefit tiers into three different time periods. For workers who began teaching in Colorado prior to 2011, their net pension benefit looks like the black line. It was not a great plan even then, and a 25-year-old beginning teacher would have had to serve for at least 20 years before qualifying for a pension worth more than her own contributions. Needless to say, most Colorado teachers don’t make it that far.
But rather than fixing this problem, Colorado keeps making it worse. In 2010, Colorado legislators cut benefits for all teachers who began their service in 2011 or later (represented by the gray line in the chart). Teachers would have to work longer for their benefits, and it would take them longer to reach the benefit “peak.”
Even that cut has not been enough. The state’s unfunded liability has continued to grow, despite a record run in the stock market, so in 2018 year legislators went back to the bargaining table to address the teacher pension problem again. And once again, they cut benefits for new workers. The red line shows what retirement benefits will look like for all teachers hired after 2020. They will be forced to pay higher contributions for less generous benefits, making their net pension value even worse. The same 25-year-old teacher must stay for 26 years before her pension is finally worth more than her own contributions plus interest. Needless to say, even fewer Colorado teachers in the future will make it that far.
Colorado is also one of the 15 states that does not enroll its teachers in Social Security. Teachers have nothing else to fall back on, and yet the state has created a plan that purposefully limits adequate retirement benefits to only a small fraction of people who remain teaching in Colorado for their entire career. That shouldn’t even be legal.
Now, all other state employees in Colorado except teachers have the option to join the portable PERA-DC plan. Under that plan, participating employees will contribute 8 percent of their salary, and employers will chip in another 10 percent. It’s run by the state, which ensures members have good investment options with low fees. Based on my estimates, more than 90 percent of Colorado teachers would be better off in the PERA-DC plan.
To be clear, this trend is playing out across the country. In state after state, teachers are being asked to pay more money for the same or worse benefits. But rather that fighting to preserve an expensive, unfair status quo, teachers should demand retirement plans worth fighting for.
The holidays bring multiple generations together, although that won’t mean they’ll see eye to eye on every issue. In fact, if the discussion turns to pension benefits, it might be tempting for younger family members to respond by saying, “OK Boomer.”
That now-viral phrase expresses the general frustration that Millennials and Gen Z have with older generations doling out dismissive lectures and being unable to see the perspective of younger generations.
Teacher pensions (or public pensions generally) may be one of those triggers – largely because it pits generations against each other: Older generations racked up billions in debt and the younger generations are now supposed to pay for it.
There’s no guarantee pensions will come up at your next family gathering, but if it does, here’s one way that conversation might go:
Gen Z high school student: Supposedly our state is spending more money on schools, but it sure feels like my school is getting less.
Millennial teacher: I agree. We teachers haven’t seen our salaries grow very much.
Retired Boomer: Education spending is up, but a portion of that money is being used to pay for the promises we made to retirees. The pension debt for teachers and other educators is more than $500 billion, and that has to be paid by someone.
Millennial teacher: Wait, “we” didn’t make those promises. Why should I pay for those? Even if I stay in teaching, my pension won’t be that generous. Since they changed the rules, I won’t get to retire in my late 40s or early 50s like some of my older colleagues did. And my take-home pay is smaller because I’m paying higher retirement costs than those colleagues did when they were teaching.
Boomer: A promise is a promise.
Millennial: But aren’t the Boomers the ones who made those promises? We weren’t even there. You made promises that obligated US to pay for YOUR retirement?
Boomer: Pensions help attract and retain high-quality teachers.
Millennial teacher: Not for my generation! My teacher friends are tired of being asked to take on more responsibilities without any increases in pay.
Boomer: Young teachers just need to stick it out. You’ll see. Pensions reward those who are truly committed.
Millennial: That sounds like a system that worked well for your generation, but not for mine. The current trajectory is simply not sustainable.
Boomer: We can't go back in time and change what was done. Retirees are depending on their pension income.
Millennial: Then they should have figured out how to pay for those obligations without passing the buck.
Boomer: Let me explain how our government works. People elect their representatives to make decisions for how our public funds are obligated.
Gen Z high school student: Ha! Next year I’ll be able to vote. We’ll see how government works then!
Boomer: (Sighs.)
Millennial: (Frustrated). Our generation will be the first that isn’t as well off as our parents. Why should we be the ones to pay for your generation’s debts?
Boomer: Look, this just has to be paid. There’s no way around it. You don’t really have a choice. Leaders will just need to be more fiscally responsible going forward.
Gen Z and Millennial: Ok Boomer.
This is intended as a fictional dialogue, and no actual Boomers, Millennials or Gen Zers were harmed in the process.
That said, it is increasingly representative of the current public debate over pension funding. At least for now, most states are tackling their pension problems by decreasing benefits for new generations of workers or by diverting funding meant for today’s students. While we aren’t proposing any specific solutions here, the current trajectory may not be tolerable for new generations asked to pay for the promises of the past.
Marguerite Roza is the Director of the Edunomics Lab at Georgetown University and belongs to none of the generations listed here. Chad Aldeman is a Senior Associate Partner of Bellwether Education Partners and is technically a Millennial.
Do teachers value all forms of compensation the same?
A recent paper by Barbara Biasi, an Assistant Professor of Economics at Yale University, sought to find out. Exploiting a natural experiment in the wake of Wisconsin’s controversial Act 10 reforms, Biasi looked at how teachers responded to changes in their take-home pay and changes in their pensions. Read the paper yourself, or read a lightly edited transcript of our conversation below:
Aldeman: First, can you give us a brief background on the project. What questions were you trying to address?
Biasi: The overarching research question behind the project was trying to understand if and how much public school teachers value their pensions, especially compared to other aspects of their job, such as salary or other non-monetary aspects. More specifically, the project tries to quantify the trade-off teachers are facing when they’re thinking about higher salaries when they work versus higher pensions after they retire.
Your paper was looking at Wisconsin in particular. For those who are unfamiliar, can you describe the changes Wisconsin made to teacher compensation?
Yes. Wisconsin is a state that has undergone a lot of changes in public-sector employment generally which have disproportionately affected teachers in the last ten years. There was a large reform package passed in 2011 that former Governor Scott Walker championed as a way to diminish the power of public-sector unions.
What makes Wisconsin a favorable setting to study the questions I was interested in is that on one side there were rules on the way that unions could operate and the number of things they could negotiate on with school districts, one of them being the salary schedules. In particular, Act 10, which was passed in 2011, prohibits unions from negotiating the salary schedules that determines their pay. What this means in practice is that districts can design those schedules and they’re left free to do whatever they want in terms of compensation. This opened the door for them to implement performance pay or merit-based pay or attach pay to other types of teacher characteristics.
In an attempt to improve the state’s budget, the reform also changed retirement benefits for public school teachers. Before the reform, teachers weren’t contributing toward their pension at all. School districts were paying the full pension costs. After the reform, however, the burden of pension contributions is now equally split between school districts and teachers. In practice, that was a cut to teacher take-home pay.
In your paper, you were attempting to disentangle teacher responses to the changes in salary versus the changes in pensions. How did teachers respond to the changes?
Essentially, two things allowed me to compare the effects of pensions and salaries. The first thing is that the increase in the teacher pension contributions was something that hit all districts equally at one time. This hit at the end of 2011, and there was no variation in how that reform hit school districts.
In contrast, the end of collective bargaining was phased in as district collective bargaining agreements, which they had negotiated with teachers prior to the state reforms, expired over time. Also, while the change in the pension contribution only affected teachers once, the changes in the collective bargaining, such as the introduction of performance pay, would affect teacher compensation both as they’re working and in pension benefits after they quit working. That’s because teacher pension formulas in Wisconsin (and most other states) are calculated as a function of a teacher’s gross salary.
What I looked at is how teacher retirement behavior, namely the number of teachers who decide to retire each year, evolved in different districts over time. The idea is that we can infer teachers’’ preferences by looking at their retirement behavior. The variation in how the reforms were phased in allows me to look at how people respond to changes in salaries versus changes in salaries and pensions.
The one-line summary of what I find is that teachers seem to be more responsive to changes in salaries than they are to changes in pensions.
I have a couple explanations in the paper for why I think that might be the case. One of the things I explore is that a decrease in net salaries is very salient. People notice that their paycheck is smaller, whereas people might think less about a change in how a pension benefit would be calculated if they decided to retire.
To test that, I try to see if people who are teaching in schools and grades where a larger share of their colleagues are also eligible to retire—in Wisconsin that means being at least 55 with five or more years of experience—whether those teachers are more responsive to changes in pensions. The idea with this test is to see if people being more exposed to how the pension plan works are also more likely to retire. And they are. People who have more colleagues who are thinking about retirement are more responsive to any changes in the size of their pensions.
The second hypothesis I tried to test is whether there might be credit constraints that block people from responding to a change, such as pensions, that will primarily affect them in the future. What I do there is look to see if the teachers who have negative shocks to their housing wealth are less responsive to the changes in pensions. I find that they are. I use the changes in house prices over time and across geographic areas in Wisconsin to show that people who experience negative shocks to their housing wealth are less responsive to pension changes. This supports the idea that credit constraints might play a role in explaining why people are not very responsive.
What can you say about differences in teacher responses? Did teachers respond differently based on their age, location, or teacher quality?
The only way I have to measure teacher quality is through value-added scores, so my sample becomes smaller because I can only use teachers in the tested subjects, math or reading. With that caveat, what I find is that lower-quality teachers are slightly more likely to respond to changes in pensions. My interpretation of that is that those teachers experience a larger expected shock to their pensions because of the other salary reforms going on at the time, such as merit pay. They might expect that any changes in their gross salary are likely to continue over time.
Overall, this reform led to disproportionate retirement of lower-quality teachers.
Your data is about a particular state with a particular set of reforms, but you also simulate a sort of “grand bargain” to swap higher early-career pay in exchange for lower pension benefits at the back end. Can you talk about what you found?
The goal of that simulation is to try to understand the following thought experiment: The State of Wisconsin was trying to cut the budget by a certain amount. They decided to do that by leaving the pension formula unchanged, while cutting teacher take-home pay by making them contribute more to the pension fund.
The question I ask is, what would have happened if the state had decided to save the same amount of money but in a different way, by essentially changing the pension benefits teachers would receive. What I find is that this alternative type of change, again with the same savings, would have resulted in fewer teachers retiring and more experienced and lower-quality teachers retiring. From the standpoint of students, it would have been better.
In the pension world we often refer to pensions as “deferred compensation,” but what does it mean if employees don’t have very strong reactions to changes in the amount of deferred compensation they receive? What your paper is showing is that $1 of compensation is not received in the same way if it comes in the form of salaries or in the form of pensions. Is that right?
I think you’re right in summarizing the punchline of the paper. The implication is that, if we need to cut people’s overall compensation, we probably don’t want to cut what’s most salient to them – namely salaries – because this will generate large welfare losses.
The flip side of this is that if you want to attract and retain good teachers into the profession, it’s probably more worthwhile to think about increasing salaries than increasing a form of compensation, like pensions, that some teachers might see and some might not see if they change jobs.
One other thing I should mention is that the results are derived out of a sample of teachers who are around the age of 55. Presumably those are the teachers who are already thinking of retirement and are the ones who should be the most responsive to pensions. If that sample of teachers are not thinking about pensions all that much, teachers who are younger are probably thinking about pensions even less.
Taxonomy:The Chicago Teachers Union leaders were adamant that they weren’t on strike over salaries, but rather were fighting for educational justice in the form of more staffing. Now that the dust has settled, the numbers support that claim. Teachers didn’t gain anything in terms of salary that wasn’t already offered before the strike started. Instead, they lost six days of pay for the missed school days. (They struck for 11 days, but will make up five of them.)
For the average teacher, the unpaid strike time amounts to $2,100 in lost wages. There goes most of this year’s raise.
But it’s the senior teachers nearing retirement that got hit with a double whammy. First, their salaries are higher (some as high as $111,000) so the lost wages can total as much as $3,200 per teacher. Then, for teachers retiring in the next four years, those lost salary dollars will result in lower pension payments. Because pension amounts are based on the last four years of salary, teacher pensions are highly sensitive to even modest changes in salary during any one of those final years. For the six lost days of work, retiring teachers should expect a dip of a little over $600 per year, but that loss affects every single year of retirement. Using standard assumptions of lifespan and discounting, it is clear that the effect on pension amounts to a loss for a retiring teacher of more than $9,500 in today’s dollars.
That means, for a teacher at the top of the pay scale retiring in the next four years, the strike meant walking away from salary and pension payments totaling nearly $13,000. Ouch.
Perhaps it was because of these losses that the final-hour negotiations included union demands for higher pay for senior teachers. As the strike ended, the mayor pledged $5M per year toward extra pay for teachers with more than 14 years’ experience. We don’t yet know how these funds will be doled out, but if the cash gets spread evenly among all the teachers who qualify, it will amount to under $600 per teacher annually for the duration of the five-year contract. Still to be decided is whether those additional dollars would be factored into pensions. (Given that the district’s pension fund is already billions in the red, these kinds of decisions affect all sides.) Either way, the extra veteran pay will hardly offset the lost earnings.
Chicago Board of Education President Miguel del Valle called the walkout a sacrifice for all involved but said that the resulting contract will make the education system stronger.
Under the new contract, every school will be staffed with the mix of adults prescribed by the union, taking away school-level control over such decisions. Teachers gave up cash to support that; soon-to-retire teachers gave up the most.
Whether the system will be better for students remains to be seen (as does the impact on the district’s financial health). But we can see the financial tradeoff that teachers made. The question for them is, was it worth it?
Taxonomy: