The following is a guest piece from Carrie Hahnel, on behalf of The Opportunity Institute. Carrie thanks Guy Johnson, Christopher Edley, and Chad Aldeman for their guidance and input. Follow Carrie on Twitter at @CarrieHahnel.
Introduction
When California passed the Local Control Funding Formula in 2013, it represented a political consensus that state education aid should be distributed based on student needs,[1] and that a primary role of state funding is to mitigate the impact of locally-based funding inequities. These are fairly uncontroversial positions, and represent a principled approach to equity that is mirrored in the way federal education funds are spread across districts and schools. State and federal policies that level the playing field are essential because young people affected by poverty, segregation, discrimination, and trauma often have greater educational needs. Without some kind of counterbalance, history tells us that local policies and funding too often exacerbate inequities.
Yet when it comes to teacher pensions--a significant form of state spending on education, and a major part of the education budget--this equity principle is rarely discussed.
The Opportunity Institute urges this to change, since equity is its main concern. This concern is anchored in the belief that Americans ought to have a shared interest in public investments that support the success of each and every child. In considering pension equity, the Opportunity Institute starts from the premise that we can: (1) honor the wage and retirement-related promises we have made to our teachers, staff, and school leaders, and (2) provide timely and sorely-needed services to those students in greatest need.
Pension spending as a form of state investment is particularly salient in California, because the state – not just employees and their employers – contributes to the California State Teachers’ Retirement System (CalSTRS). This makes CalSTRS somewhat unique among teacher pension programs. The state of California alone will pay $4.4 billion into the teacher pension fund in 2019-20, which is about 6 percent of total K-12 spending and more than $700 per student. That is on top of the roughly $1,280 per student that districts will spend on teacher pensions this year.[2]
Policy makers and the public should demand to know who is reaping the greatest share of the benefits from that investment. Do teachers and students in our neediest communities benefit more than their counterparts in wealthier areas? Our analysis suggests they do not. At best, the current system is approaching an equal distribution of dollars, with wealthier districts benefiting somewhat more from this state investment than poorer districts. It is a far cry from equity.
Teachers in all parts of our state deserve good retirement benefits--this is good for the profession and good for students. At the same time, equity advocates should ask whether the state should be boosting wealthy communities’ total compensation, particularly when it comes at a real cost to less well-off districts.
Background
Most public school teachers in California are paid according to locally bargained salary schedules and receive locally determined health and welfare benefits. California teachers do not participate in Social Security, so they rightly expect their pensions to provide reasonable retirement security. Most are eligible to receive a state pension and participate in the California State Teachers’ Retirement System (CalSTRS). This is funded by contributions from employees, districts, and the state. The benefit itself is determined by a teachers’ years of service and final salary, with many of these benefits backloaded. A new teacher starting out today who works 32 years in the CalSTRS system could retire at age 62 with annual retirement benefits equivalent to about 64 percent of his or her final salary.[3]
Unfunded liabilities
The cost of teacher pensions in California is rising, but not necessarily because teachers are getting paid more or because their benefits are improving (aside from annual inflation adjustments). Instead, costs are on the rise because investment returns have not kept up with projected returns, people are living longer, and the number of workers contributing to the system is lower than the number who are drawing on it. These factors and others have contributed to a massive unfunded liability. As of June 2017, the unfunded liability of the California State Teachers’ Retirement System (CalSTRS) – the amount it will owe to teacher retirees over the next 30 years but hasn’t yet funded – stood at $107 billion.[4] That’s about the GDP of Ecuador, or enough to cover University of California tuition, fees, and living expenses for more than 20,000 students per year for the next 30 years.
Rising contribution rates
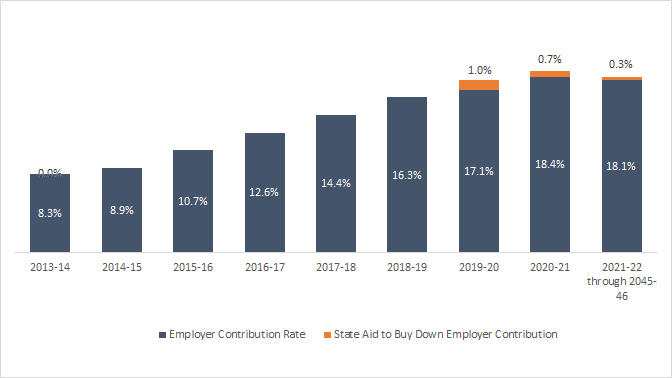
To chip away at this liability, the legislature has been gradually increasing state and district contribution rates. In 2019-20, school districts will pay 17.1% of a certificated staff member’s salary, the state will pay 10.3%, and employees will pay 10.3%. In total, 37.7% of each teacher’s salary will be paid into the pension fund this year. By comparison, Social Security collects 6.2% each from employees and employers, for a total contribution rate of 12.4%.
This contribution is expensive for cash-strapped school districts, but it could have been worse. Rates were expected to rise to 18.1% this year and 19.1% next year, as required by Assembly Bill (AB) 1469, signed into law by Governor Brown in 2014. Recognizing the fiscal strain this has placed on school districts, Governor Newsom’s 2019-20 budget invests $850 million over the next two years to buy down the CalSTRS and CalPERS contribution rates and offer districts some short-term relief. (See Figure 1.) In addition, the budget includes $2.3 billion in supplemental payments to the pension fund to decrease districts’ share of the long-term liability. These two moves are expected to save districts approximately $6.1 billion over the next three decades. Finally, the budget also included $3.6 billion in supplemental payments to decrease the state’s share of the liability.[5]
Figure 1: Employer CalSTRS contribution rates have risen sharply under AB 1469, but the state is buying down these rates over the next two years
State Pension Aid Disproportionately Benefits Wealthy Communities
Since pension benefits are a function of a teacher’s salary at the time of retirement, higher paid teachers will draw down more in pension benefits than lower paid teachers. Therefore, districts that can pay teachers more will draw more state pension aid on behalf of their employees than lower paying districts.
Districts with higher teacher salaries tend to be those serving fewer low-income, English learner, and foster youth students—a category the state calls “unduplicated” under LCFF, but that we will call “high need” for simplicity’s sake. This is demonstrated by Figure 2, which compares teacher salaries in high and low-need districts.
Figure 2: On average, teachers in low-need California school districts receive nearly $9,000 more in annual salary than teachers in high-need districts
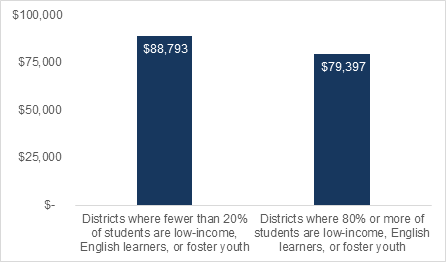
Source: Analysis of 2017-18 J-90 data, in combination with the percentage of students who are unduplicated low-income, English learners, or foster youth, as reported by the California Department of Education
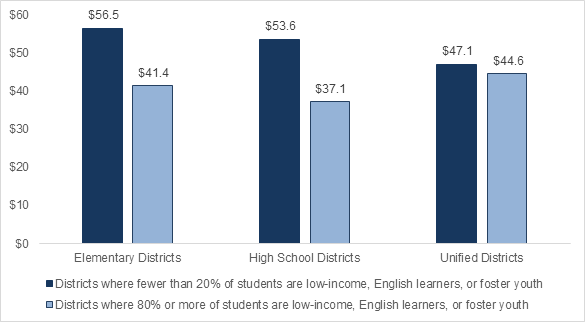
Using teacher salary data, we estimated how much of a benefit different districts were likely to receive from Governor Newsom’s $850 million pension aid package. Specifically, we estimated how much the first-year rate-buy down would save each district. On average, elementary, high school, and unified districts will save $43 per student. The differences between districts based on student need are not extreme, but they are regressive. That is, less-needy districts – those with fewer low-income, English learner, and foster youth students – will receive more of a benefit since their teachers have higher salaries. (See Figure 3.)
Figure 3: Lowering the CalSTRS contribution rate from 18.1% to 17.1% will save districts $43 per student, and low-need districts will fare slightly better than high-need districts
This analysis looked at only the $850 million rate buy-down, not the additional $2.3 billion Gov. Newsom has put into reducing districts' long-term liabilities. But the calculus is essentially the same - state aid that is distributed as a function of teacher salaries will lead to regressive investments. For instance, we estimated that in 2017-18, the state contributed $510 per student in pension aid on behalf of low-need elementary districts, but only $402 per student in high-need elementary districts. That’s a gap of $108 in pension spending.
If we were to look at school-level rather than district-level spending, the gap would probably be even larger because schools in wealthier neighborhoods often have higher paid teachers. Indeed, a 2017 analysis of Illinois pension spending data found that the state contributes $566 more per student in the wealthiest schools than in the poorest.[6]
Undercutting the Promise of LCFF
The promise of LCFF was that higher-need students would benefit from greater resources that would be used to level the playing field. And to be sure, the state is now directing more funding to education than ever before, and it is spending more equitably than in the past.[7] But unfortunately, regressive policies that direct a disproportionate share of money to wealthier communities—whether intentionally or not—cut against that promise. It’s not just this pension aid package, which is only modestly inequitable. It is also the fact that wealthier communities already have the means to raise more money for schools. Wealthier communities are already more likely to:
- Pass parcel taxes. In 2017-18, 113 districts had parcel taxes. The average district that approved a parcel tax was only 32 percent free or reduced-price lunch and generated an average of $1,080 per student.
- Raise facilities funding through bonds. Districts with greater property wealth raise significantly more money through local revenue bonds; state modernization funds also disproportionately benefit wealthier districts.[8]
- Generate local revenues through donations, PTAs, and other sources. Some districts, including Piedmont City Unified, Portola Valley Elementary, Hillsborough City Elementary, Orinda Union Elementary, San Marino Unified, and others report that they raise more than $1,500 per student from local sources. This is only the amount reported and does not include all financial or in-kind donations. These local revenues can be used for many things, but they often help to improve existing services by reducing class sizes or helping to buy additional programs like art, music, gardening, or field trips.
Regardless of whether communities have a robust local tax base, wealthy residents, and/or parents who are simply able to contribute more to their local schools, the result is that these districts can independently invest more in facilities, teacher salaries, and other programs and services than can lower-wealth districts. When the state distributes state aid on top of this in an equal or regressive fashion, it exacerbates inequities.
A tale of two districts
To illustrate how these differences stack up, let’s take a look at two school districts in San Mateo County on the San Francisco Peninsula. Redwood City Elementary and Menlo Park City Elementary share a boundary, with Redwood City spanning a larger, less wealthy, and more diverse area to the north, and Menlo Park covering a smaller, higher-income, and more white area to the south, just a few miles from Stanford University. Both communities are home to many tech giants and skyrocketing home prices.
Figure 4: Two neighboring districts illustrate large funding disparities
| Redwood City Elem. | Menlo Park City Elem. |
Students qualifying for free/reduced-price meals | 51% | 9% |
Students who are non-white | 80% | 50% |
Median household income[9] | $86,000 | $156,000 |
Parcel tax dollars per student[10] | $230 | $2,800 |
Other local revenues per student[11] | $780 | $1,600 |
Total per-pupil spending[12] | $12,834 | $16,583 |
Average teacher salary[13] | $78,000 | $107,000 |
Both districts have been successful in passing parcel taxes, although Menlo Park has four separate taxes that stack up to $1,089 per parcel, while Redwood City tried multiple times to levy a parcel tax before finally passing a modest $85 per-parcel tax in 2012. Menlo Park’s four parcel taxes bring in about $2,812 per student each year, while Redwood City’s parcel tax brings in just $233 per student.
Menlo Park reports other local revenues of $1,884 per student, while Redwood City reports $841.These and other differences in local fundraising stack up. Despite the extra bump Redwood City gets from LCFF, it spends $12,834 per student each year, significantly less than Menlo Park’s $16,583 per student. As a result, Redwood City has less to spend on major expenses such as teacher salaries. The average teacher salary in Menlo Park is $107,000 while the average teacher salary in Redwood City is $78,000.
Under Governor Newsom’s pension rate buy-down, Menlo Park will save about $71 per pupil while Redwood City will save about $39 per student. In total, the state annually pays about $770 per pupil in pension aid on behalf of Menlo Park but only $423 per pupil on behalf of Redwood City.
What Can the State Do?
At a time when rising pension and benefit costs are squeezing school district budgets and leading to painful reductions in student services,[14] the state should be seeking every opportunity to ease the burden on school districts through equity-centered policies, not regressive approaches that exacerbate inequities.
To the extent the state is going to contribute more general fund dollars to schools, it should first prioritize the needs of communities that are under-resourced or marginalized. Researchers, policy makers, policy advocates, and community leaders should come together to propose viable solutions—but here are a few ideas to start.
- Fold state aid otherwise intended for immediate district pension relief into LCFF, so it is distributed equitably. The pension contribution rates would remain high, but districts could engage with their local communities to make decisions about how to best use their funds. There is certainly the risk that any “new” dollars would be sunk into across-the-board salary increases (which will also ratchet up pension costs), especially in districts with strong unions. The state would have to safeguard against this, potentially by finally and firmly constraining the use of LCFF supplemental and concentration grants, among other strategies.
- During years of strong economic growth, prioritize paying down the unfunded liability over offering relief directly to school districts. As the Legislative Analyst’s Office has pointed out,[15] this will benefit communities in the long run since it will accelerate progress toward a fully funded pension system. Prioritize district relief during economic downturns, when low-income students, English learners, and other vulnerable populations inevitably suffer from reductions in services.
- Rather than limit the ability of districts to raise money locally, find ways to capture and redistribute some of that funding. For example, require that a portion of local donations, such as parent contributions, be redistributed to poorer schools, or offer greater tax deductions for donations made in poorer school districts. Explore state measures that will expand local tax authority while building in safeguards to recapture, redistribute, and backfill funds to less wealthy communities.
- Consider hybrid plans that mix traditional pension benefits with quickly vesting, portable defined contributions. These plans could guarantee teachers retirement security while also allowing for mobility - which could be attractive to younger teachers. These types of plans could also help reduce state liabilities in the long run, which would free up more dollars to invest in schools through LCFF. Virginia, Tennessee, and Rhode Island have hybrid plans that may offer lessons learned.
- Incentivize or encourage districts to create differentiated pay opportunities for teachers working with high-need populations, such as special education students or English learners, or in schools with high concentrations of poverty. This would result in higher salaries in higher need communities and would ensure that local and state pension aid is more equitably distributed.
No doubt there are opportunities to refine these ideas and introduce new ones. The overriding goal would be to ensure that any state investments in education--pension payments included--are steered by principles of fairness and equity.
______________________________________________________________
[1] The Local Control Funding Formula provides every district with a base funding amount and additional funding based on the percentage and proportion of students who are low-income, English learners, or foster youth.
[2] Based on my own analysis using California Department of Education 2017-18 expenditure data and projecting ahead using new pension contribution rates.
[3] Benefits vary depending on several factors, including age of retirement and years of services. Teachers who began teaching in 2012 are eligible to enjoy slightly better benefits under the “CalSTRS 2% at 60” structure, while teachers who began in 2013 or later fall under the “CalSTRS 2% at 62” structure. See the CalSTRS member handbook for more details.
[4] Defined Benefit Program of the California State Teachers’ Retirement System, June 30, 2018 Actuarial Valuation, Milliman, Inc.
[5] https://lao.ca.gov/Publications/Report/4083 and http://www.ebudget.ca.gov/2019-20/pdf/Enacted/BudgetSummary/K-12Education.pdf
[6] Max Marchitello, “Illinois' Teacher Pension Plans Deepen School Funding Inequities,” 2017: https://www.teacherpensions.org/resource/illinois-teacher-pension-plans-deepen-school-funding-inequities
[7] Rucker Johnson, Paul Bruno, Sean Tanner, “Effects of the Local Control Funding Formula on Revenues, Expenditures, and Student Outcomes,” part of the Getting Down to Facts II project, Stanford University, Sept. 2018; Theresa Chen and Carrie Hahnel, “The Steep Road to Resource Equity in California Education,” The Education Trust - West, 2017.
[8] Eric Brunner, Jeffrey M. Vincent, “Financing School Facilities in California: A 10-Year Perspective,” part of the Getting Down to Facts II project, Stanford University, Sept. 2018.
[9] Household income and race data are from Ed-Build: https://edbuild.org/content/dividing-lines/main.
[10] Parcel tax revenues from Ed-Data.
[11] Ed-Data 2017-18 General Fund Revenues. Other local revenues exclude parcel tax revenues.
[12] Ed-Data 2017-18 Current Expense of Education per ADA (per Education Code Section 41372).
[13] Analysis of 2017-18 J-90 data.
[14] Hannah Melnicoe, Carrie Hahnel, Dr. Cory Koedel, and Arun Ramanathan, “The Big Squeeze: How Unfunded Pension Costs Threaten Educational Equity,” Pivot Learning, Oakland, CA, 2019.
[15] Legislative Analyst’s Office K-14 Pension Rate Relief Proposals Handout: https://lao.ca.gov/handouts/Conf_Comm/2019/K-14-Pension-Proposals-053019.pdf.