In Georgia, K-12 school teachers are automatically enrolled in a defined benefit pension plan.
In contrast, at Georgia’s public colleges and universities workers are given a choice between the same pension plan or a defined contribution plan.
Why don’t K-12 teachers have the same choice as their peers in higher education?
Georgia's K-12 teachers deserve a better choice, because the current plan run by the Teachers Retirement System (TRS) of Georgia plan is poorly designed for the vast majority of its enrollees. The TRS pension plan requires a 10-year vesting period before workers qualify for any retirement benefits; this is so long that it would be illegal in the private sector. Georgia also does not provide Social Security coverage to all of its K-12 teachers, leaving some teachers entirely dependent on their TRS benefits. And yet the TRS formula delivers adequate benefits to only a fraction of members who remain teaching in Georgia for their entire career.
The vast majority of Georgia’s K-12 teachers would be better off in a plan offered to the state’s higher education employees. Unlike elementary and secondary teachers, workers at Georgia’s public colleges and universities are allowed to choose between either the TRS plan or the Optional Retirement Plan (ORP). Originally designed for university professors moving across higher education institutions, the ORP also has a number of features that would be attractive to K-12 teachers.
In contrast to the TRS plan, the ORP offers immediate vesting, which means that all workers begin accruing retirement benefits immediately, starting from their first day on the job. Georgia higher education employees are also covered by Social Security, meaning they receive a nationally portable, progressive benefit that many of Georgia’s K-12 teachers lack.
It may sound counter-intuitive, but the ORP is simultaneously more generous to employees and less costly to employers. It’s due to how each plan works. The TRS plan is based on a series of assumptions. It offers benefit through a formula, and the state estimates how much those benefits will be worth down the road and how much the plan needs to invest today in order to pay for those future benefits. When the state is wrong about any of those assumptions, or when it fails to save sufficiently, pension plans can accrue unfunded liabilities. Today, Georgia school districts are paying a total of 20.9 percent of each teacher’s salary into the TRS pension plan, but only about one-third of that (7.7 percent of each teacher’s salary) is going toward benefits for workers. The rest (13.13 percent of salary) is going to pay down those unfunded liabilities.
In contrast, the ORP has no unfunded liabilities, and it never will. Under the ORP plan, a worker's benefit is defined in terms of how much is contributed into the plan, and how fast those investments grow. There are no assumptions to worry about, and hence the plan will never accumulate unfunded liabilities. Georgia’s colleges and universities today are contributing 9.24 percent of each participating employee’s salary into the plan. That is both more generous to workers than the TRS plan (9.24 versus 7.77 percent of salary toward benefits) and less costly overall (the same 9.24 in ORP versus the total 20.9 percent in TRS).
Comparing Key Elements of Georgia Retirement Plans
Teachers Retirement System of Georgia (TRSGA)
Georgia Optional Retirement Plan (ORP)
Vesting period
10 years
Immediate
Employee contributions
6.0 percent
6.0 percent
Employer contributions for benefits
7.77 percent
9.24 percent
Employer contributions for unfunded liabilities
13.13 percent
N/A
Total employer cost
20.9 percent
9.24 percent
Social Security coverage
Varies, depending on school district
Yes
There is one other element we haven’t discussed yet, and that is fairness. The ORP plan is more generous to participating workers on average, and it treats all workers the same. Every ORP plan member contributes the same percentage of their salary, and every ORP member receives the same percentage* contributed on their behalf.
In contrast, the TRS plan does not distribute benefits evenly. Its formula awards disproportionately large benefits to teachers who stay for 30 or more years, while leaving everyone else with substantially less. The 7.77 percent employer contribution that's going toward benefits in the TRS plan is an average across all members. Some teachers will eventually qualify for benefits worth much more than that, while many more will qualify for less.
The graph below shows how benefits would accumulate for teachers under the TRS pension plan versus the ORP. As mentioned above, the plans are not cost-neutral, and I’ve assumed a more conservative rate of return in the ORP plan than what TRS assumes. Still, the ORP would provide more value than the TRS plan for this hypothetical teacher’s first 30 years of service as a teacher in Georgia.
This graph also does not include Social Security; it’s purely a comparison of the two state-provided retirement plans. After factoring in Social Security, it's clear that participants in the ORP are receiving much more generous retirement benefits than teachers in the TRS plan alone. While some teachers might still prefer the pension plan, Georgia should at least give its K-12 teachers the same choices offered to the state's higher education employees.
*Note: The actual dollar amounts contributed will vary based on a worker’s salary, but that’s true in both the ORP and TRS plans.
Teacher pensions exacerbate differences in teacher salaries across districts. As we’ve written previously, this has significant consequences for school finance equity. The inequity in per pupil funding between high-and low-poverty districts is even worse when pension spending is factored in. We’ve also found that pensions can deepen gender-based pay gaps in education.
In each case, the problem begins with salary disparities. Since pension plans multiply salaries as a part of their formulas, any inequities in salary will be magnified by the pension plan. In this piece we will explore how differences in districts’ salary schedules – particularly between those serving high-and low-concentrations of students living in poverty – are compounded and grow through the pension system.
Salary differences, however, are not the only way that state pension funds exacerbate inequities. In a forthcoming piece we will examine how differences in district-level retention rates also can impact school funding equity.
Differences in salary across high-and low-poverty districts
More affluent school districts can afford to pay their teachers higher salaries. Often, districts serving a more affluent community offer higher starting salaries than other nearby districts, which can be an effective recruitment tool. The differences don’t stop there. Throughout a teacher’s career, these districts have the ability to offer more generous raises and set salary schedules with greater maximum salaries, potentially increasing retention. In short, the teacher pay disparity between districts often can increase throughout a teacher’s career.
A new data tool from EdSource helps to illustrate the problem by exploring school- level teachers’ salaries across six counties in the San Francisco Bay Area (Alameda, Contra Costa, Marin, San Francisco, San Mateo, and Santa Clara counties). For each district, the tool maps teachers’ lowest starting salary, their expected salary at 10 years of experience, and the maximum salary they could earn.
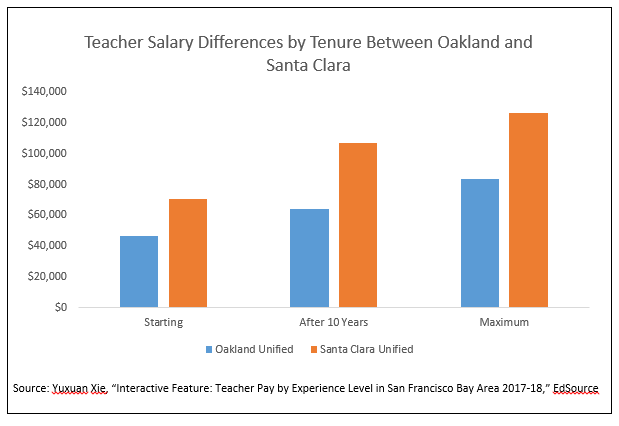
There is significant disparity across districts for starting, middle, and final salaries. Among unified school districts, Martinez has the lowest starting salary of $43,123, compared with $70,595 in Santa Clara. That is a $27,472 salary gap for a first-year teacher. The disparity is far greater among teachers earning the maximum salary. Palo Alto has the highest maximum salary for a unified school district, at $131,343, compared with $80,739 in Emery Unified. That is a salary gap of $50,604.
Consider Oakland and Santa Clara Unified school districts. As shown in the graph below, at the same level of experience, teachers in Santa Clara make considerably more than teachers in Oakland. Indeed, a 10-year veteran in Oakland will earn $6,471 less than a teacher in her first year working in Santa Clara. The maximum salary in Oakland is nearly $23,000 less than a teacher’s salary in her tenth year of service in Santa Clara. Teachers with the same level of experience can earn wildly different salaries depending on where they work. In short, the district a teacher teaches in matters significantly.
Pensions Increase Inequity Between Teachers in Oakland and Santa Clara
These disparities don’t stop while teachers are working; they continue into retirement due to the differing pensions they earn. Teachers in Santa Clara not only earn more than their colleagues in Oakland while they work, they also can expect much higher pension payments for the rest of their lives once they retire. In fact, the additional pension wealth paid to a teacher in Santa Clara is far greater than the higher contributions they paid to the pension fund due to their higher salaries while working.
If a 10-year veteran teacher in Oakland and Santa Clara both elect to retire, they will earn markedly different pensions. Indeed, the Oakland teacher’s annual pension benefit would only be about 60 percent of the pension provided to the Santa Clara teacher. Put another way, an Oakland teacher who retires after 10 years of service would earn an annual pension that is $8,519 less valuable than a teacher with the same level of experience in Santa Clara. If these two hypothetical teachers draw a pension for 20 years, the teacher from Santa Clara will receive an additional $170,380 over the course of her retirement even though she worked for the same number of years.
The disparity is even greater for those teachers who spend their entire career in the classroom and earn the maximum salary. When a 35-year veteran teacher earning the highest possible salary in the district retires in Oakland, she can expect an annual pension of $58,600. A teacher with the same number of years of experience and also earning the maximum salary in Santa Clara earned an annual pension of $88,500. That’s a yearly pension gap of $29,900 even though the teacher spent the same amount of time in the classroom and earned the highest salary offered by the district. If again these teachers draw a pension for 20 years, the teacher from Santa Clara would receive an additional $598,000 over the course of her retirement.
Since pension contributions are made as a share of a teacher’s salary, higher salaries do mean higher pension contributions. However, the slightly higher contributions made by a teacher from Santa Clara is vastly outweighed by a much larger pension windfall. Indeed, since teacher pensions are paid yearly and are determined by a formula based on years of experience and final salary, the additional pension wealth the teacher with the higher salary will receive far exceeds the value of the additional contributions she made. On net, a higher-paid teacher pays marginally more in pension contributions, but receives back considerably more than they invested in overall pension wealth.
High-Poverty Districts Subsidize Pensions in Wealthier Districts
Spending on retirement, which in California is shared between employees, districts, and the state, is yet another way that more funding is spent on the education of students from more affluent communities than on students from less financially well-off communities. In Oakland, 74 percent of students are eligible for free-and reduced-priced lunch (FRPL), a common measure of student poverty. In Santa Clara, on the other hand, 43 percent are eligible for FRPL.
Santa Clara has a greater capacity to pay teachers higher salaries, which can help the district recruit and retain effective educators, all while providing those teachers with more valuable retirement benefits which will be subsidized by every other district across the state. Pensions compound existing disparities between high-and low-poverty districts.
Although teacher pension systems are complicated, these examples illustrate how statewide pension plans can magnify school finance inequities. This is largely due to their structure and the fact that affluent districts can raise salaries without being fully responsible for the corresponding increase in retirement costs. Some states address this problem by pushing a greater share of pension costs back onto the districts themselves. While this does more closely align incentives, it nevertheless still puts higher-poverty districts at a disadvantage since they lack the necessary resources to provide higher and more competitive compensation packages to teachers.
While there are no easy solutions to this problem, policymakers should work on improving their pension systems to find ways to ensure that they do not contribute to and exacerbate inequities among districts in the state.
Taxonomy:As soon as state legislators begin to seriously ponder teacher pension reform, the specter of West Virginia is raised. Defenders of traditional pensions argue that the Mountain State’s switch to a defined contribution (DC), 401(k)-style plan and its subsequent return back to a pension plan offers definitive proof that reform cannot work.
But that story is vastly oversimplified.
The reality is that both plans are poorly designed and fail to provide a high-quality benefit to a majority of teachers, and that any structure, even one expected to better meet teachers’ retirement needs, can fail if not carefully structured.
In a new report, “Teacher Pension Reform: Lessons and Warnings From West Virginia,” I analyzed all of the state’s teacher retirement plans and modeled wealth accumulation under each of them. We found that both the pension system and the DC plan have design flaws, such as lengthy vesting periods, which severely limit the ability of either retirement plan to provide teachers with sufficient benefits.
The lesson of West Virginia’s attempt to reform its teacher retirement system is not that reform is unachievable and unnecessary. Rather, it is that structure matters. To confront the growing pension crisis, states should undertake a sober examination of their plans and seek to design a retirement system that is fair to teachers and sustainable for taxpayers.
To better understand what happened with West Virginia’s pension reform, I look at their systems through the lens of two conventional myths levied against efforts to reshape teacher retirement systems.
Myth 1: State pension plans provide a more valuable retirement benefit for most teachers.
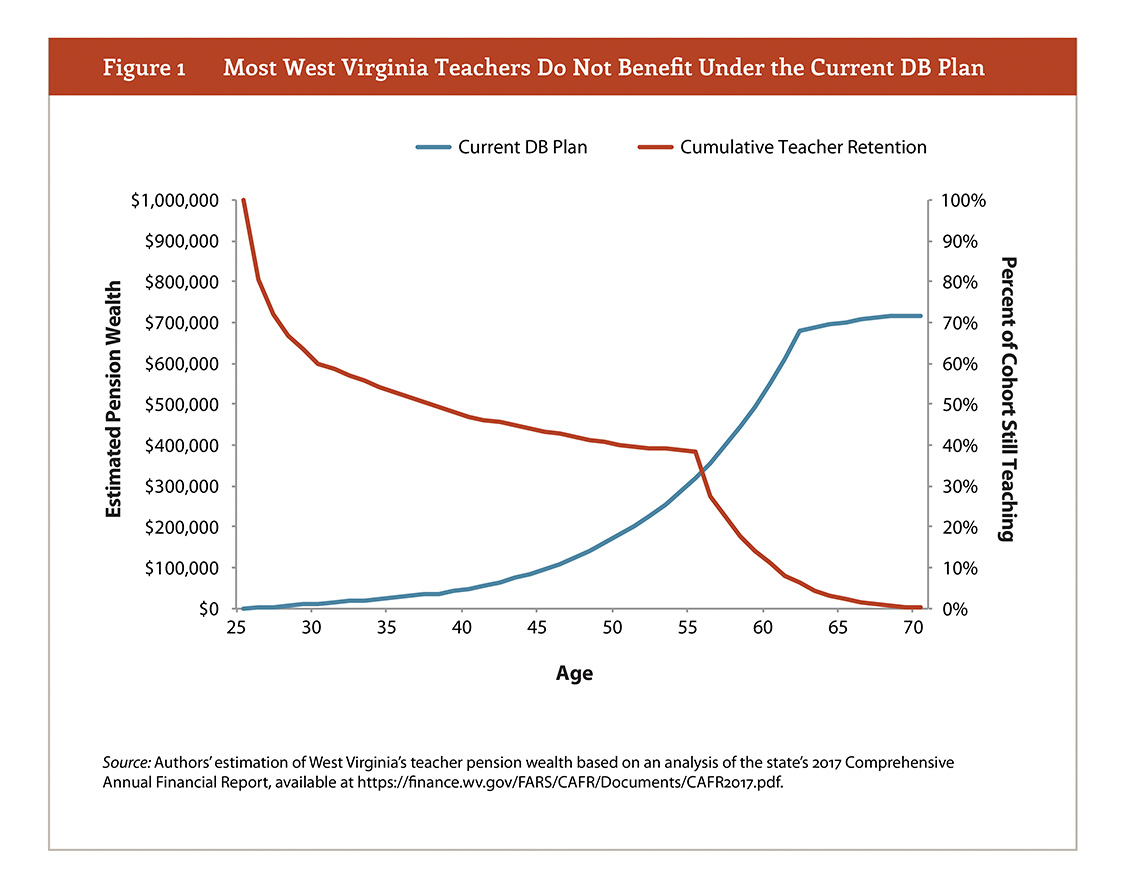
Many people consider a pension the gold standard in retirement benefits. And for those who teach for many decades, pensions usually do provide a valuable benefit. But this raises the question: how many teachers actually earn a high-quality retirement from state pension systems?
In West Virginia, the answer is not many. Due to the back-loaded structure of its pension plan formula, very few teachers in West Virginia actually reach an adequate retirement through their pension. As shown in the graph above, when wealth begins to accumulate more quickly, only about 40 percent of teachers will remain in the system. In other words, more than half of all teachers in West Virginia earn a subpar pension benefit.
Myth 2: Defined contribution plans are inherently inferior for teachers.
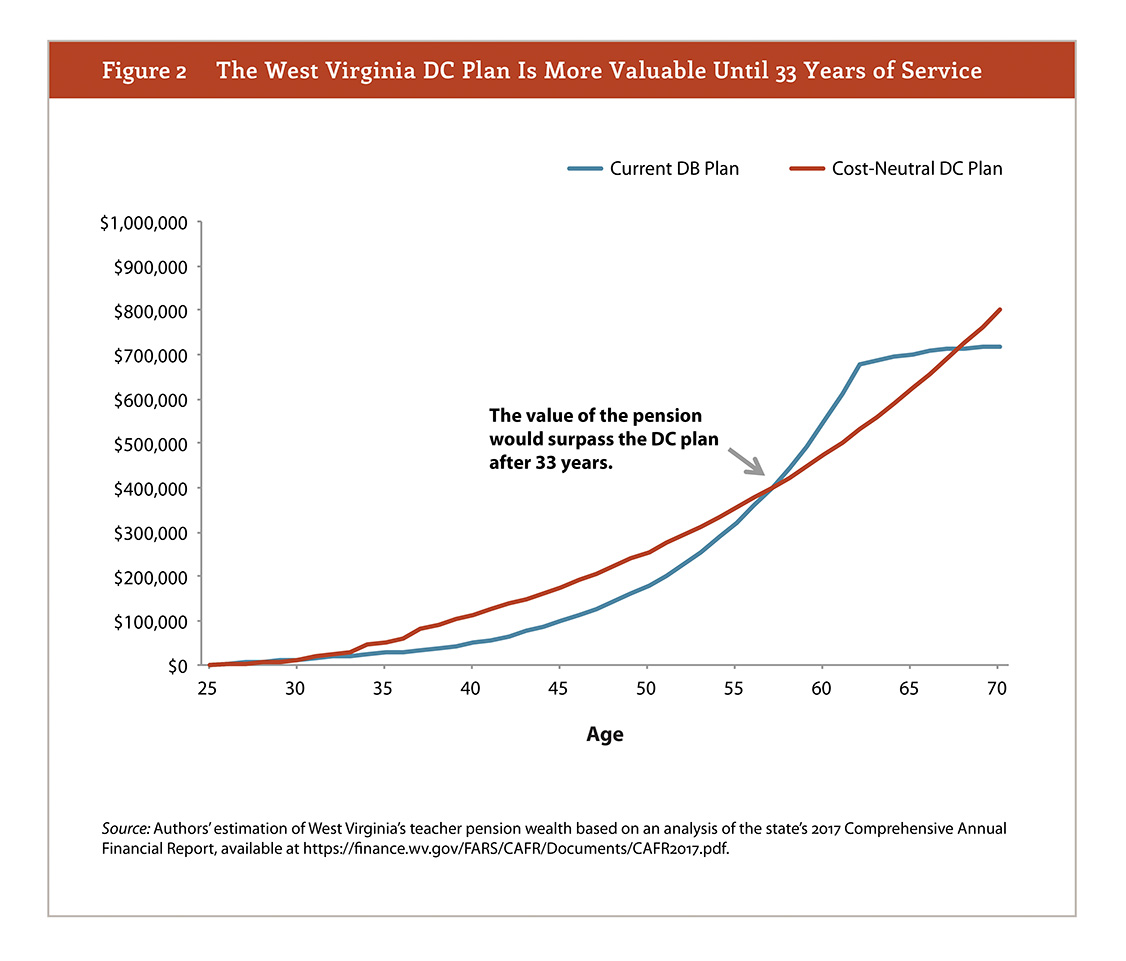
When West Virginia legislators sought to replace their pension plan, largely for cost reasons, they adopted a defined contribution plan. This was back in 1991, and the defined contribution plan the state implemented at the time was not well-designed to meet the retirement savings needs of its teachers. For example, the plan required teachers to serve 12 years before qualifying for full benefits. A shorter vesting period better aligns with teacher employment patterns. Indeed, that unusually long vesting period would be illegal in the private sector under federal regulations.
As with the old pension fund, thousands of West Virginia teachers did not meet the 12-year vesting threshold to benefit fully from the retirement fund. However, because West Virginia’s DC plan (as with all DC plans) does not rely on formulas based on years of experience as pension do, the fund nevertheless provided a more valuable benefit to most teachers when compared with the statewide pension. As shown in the graph below, it would take 33 years for the pension fund to generate retirement wealth more valuable than the DC plan. Only about 23 percent of West Virginia’s teachers will reach that point.
Myth 3: All DC plans are the same
West Virginia also serves as a useful reminder that a DC plan is not automatically better than a pension. Indeed, as my colleague Chad Aldeman wrote recently, it is possible for states to redesign teacher pension systems to better meet the needs of teachers.
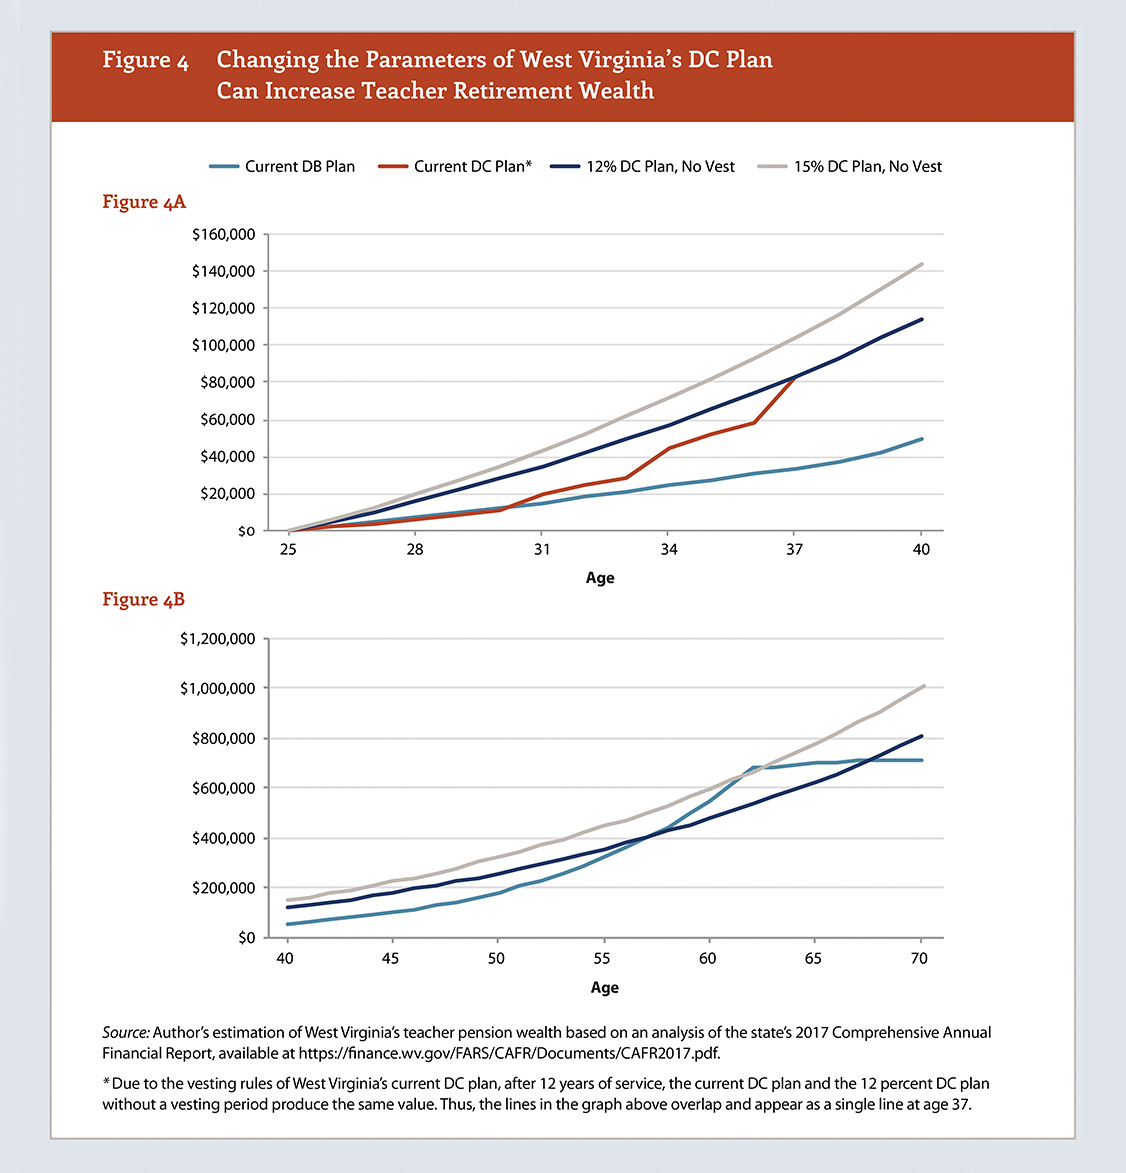
However, should a state elect to offer a DC retirement plan to teachers, they should think carefully about how to design such a system. Changing the structure of a DC, such as dropping the vesting period, or increasing the contribution rate can affect both plan’s wealth accumulation and its cost. In the graph below, I modeled two different DC plans that West Virginia – or any state – could adopt and compared them with the state’s current pension and DC plan.
A well-designed DC plan – if states decide that is what is best for their teachers and taxpayers, will avoid West Virginia’s missteps and be designed to include:
- Automatic enrollment of teachers into the program;
- The shortest possible vesting period for teachers to qualify fully for their retirement benefits;
- Employer and employee contribution rates that, at minimum, total between 10 and 15 percent;
- Low-cost options and life cycle funds that adjust an employee’s portfolio as she gets closer to retirement; and,
- An actionable and accountable plan to pay down unfunded liabilities.
West Virginia’s experience with pension reform should not be used as a cudgel against efforts in other states to address the growing pension crisis. Rather, it offers important lessons on how to more effectively adopt and implement changes to a statewide teacher retirement system. Learning these lessons is critical to effectively meeting teacher retirement needs as states continue to grapple with rising teacher benefit costs.
Late last month, the U.S. Census Bureau released an update of spending in American elementary and secondary schools. I've already dug into the national numbers, but it's also worth taking a look at how spending patterns have changed across the states over time.
Overall, schools spent* about 5.4 percent more per pupil ($628) in 2017 versus 2008, in inflation-adjusted dollars. But these national figures hide significant variation at the state level both in terms of total spending and in how states are choosing to spend their money. As with the national figures, states are spending more and more of their education budgets on things like employee benefits and other support services while spending less on teacher salaries.
Other reports, like this one from the Center on Budget and Policy Priorities (CBPP), have found that some states are still spending less than they did prior to the 2007-9 recession. I'm looking at a slightly different calculation than CBPP did--they appear to be looking at revenues as opposed to expenditures, and it's not clear if they were looking at total spending or only current spending, my preferred metric. Still, I also find that K-12 spending is down in real terms over the last 10 years in 15 states:
K-12 Spending Is Below Pre-Recession Levels in 15 States
Florida............................................................................ -11.0% Oklahoma....................................................................... -8.4% Georgia.......................................................................... -7.6% Alabama........................................................................ -7.4% Arizona........................................................................... -6.7% Idaho.............................................................................. -4.3% Colorado......................................................................... -4.2% New Mexico................................................................... -3.4% Mississippi..................................................................... -1.6% Indiana........................................................................... -1.5% Virginia........................................................................... -1.2% Wisconsin....................................................................... -0.7% Nevada........................................................................... -0.3% Louisiana........................................................................ -0.3% Texas............................................................................. -0.1% The Census Bureau breaks down their spending figures into a few different categories, and I'll look at them separately. First up is total salaries and wages. Nationally, that figure is up but only by 0.3 percent, in real terms. 23 states are spending less on salaries and wages than they did pre-recession:
Spending on Salaries and Wages Is Below Pre-Recession Levels in 23 States
Florida............................................................................ -16.2% Oklahoma....................................................................... -13.3% Georgia.......................................................................... -10.0% Arizona........................................................................... -9.9% Louisiana........................................................................ -9.5% Alabama........................................................................ -8.0% Idaho.............................................................................. -7.7% New Mexico................................................................... -7.7% North Carolina................................................................. -7.0% Michigan........................................................................ -6.6% Indiana........................................................................... -5.8% Kentucky........................................................................ -4.7% South Carolina................................................................. -4.6% Virginia........................................................................... -4.4% Mississippi..................................................................... -3.4% Arkansas........................................................................ -2.8% Nevada........................................................................... -2.6% Kansas.......................................................................... -1.6% Texas............................................................................. -0.9% New Jersey..................................................................... -0.8% Wyoming......................................................................... -0.5% Missouri........................................................................ -0.3% Colorado......................................................................... -0.2% The trends look even worse when you focus solely on what the Census Bureau calls salaries and wages for instruction. This category separates out things like school and district supports and administration and is the closest we can get to identifying how much money schools paid directly to teachers. Unfortunately, of all the Census Bureau categories, this is the only one that actually declined over the last 10 years. Nationally, salaries and wages for instructional employees fell by 0.3 percent over the last 10 years in real, per pupil terms. In fact, as of 2017, 28 states were spending less on instructional salaries than they were 10 years prior:
28 states are spending less on instructional salaries than they did pre-recession
Florida............................................................................ -16.8% Oklahoma....................................................................... -15.9% Arizona........................................................................... -14.1% Louisiana........................................................................ -13.5% Georgia.......................................................................... -11.7% Alabama........................................................................ -8.5% Indiana........................................................................... -8.4% New Mexico................................................................... -8.3% Idaho.............................................................................. -8.2% North Carolina................................................................. -7.8% South Carolina................................................................. -7.4% Mississippi..................................................................... -7.1% Kentucky........................................................................ -6.5% West Virginia................................................................... -5.0% Arkansas........................................................................ -4.6% Virginia........................................................................... -4.3% Michigan........................................................................ -4.0% Colorado......................................................................... -4.0% Maryland........................................................................ -2.8% Texas............................................................................. -2.8% Missouri........................................................................ -2.4% Wisconsin....................................................................... -2.3% New Jersey..................................................................... -1.3% Nevada........................................................................... -1.3% Tennessee....................................................................... -1.2% Wyoming......................................................................... -1.1% California........................................................................ -0.4% Kansas.......................................................................... -0.3% It's probably no coincidence that states with notable recent teacher strikes--including Oklahoma, Arizona, North Carolina, Kentucky, West Virginia, Virginia, and Colorado--all made this list.
In addition to salaries and wages, the Census Bureau also reports spending on employee benefits, including pensions and health care. In contrast with salaries and wages, which were flat or declining, benefit spending rose 23.5 percent, in real terms, over this same time period. Only five states managed to keep their benefit spending in check, whereas 31 states plus the District of Columbia experienced double-digit (!) increases in benefit spending:
31 states and the District of Columbia experienced double-digit increases in benefit spending
Ohio............................................................................... 12.3% Montana........................................................................ 12.3% Nevada........................................................................... 13.3% South Dakota.................................................................. 13.7% Kansas.......................................................................... 14.1% Oregon........................................................................... 14.8% Tennessee....................................................................... 14.9% Missouri........................................................................ 16.2% New Jersey..................................................................... 17.6% Maryland........................................................................ 17.6% Iowa.............................................................................. 17.9% South Carolina................................................................. 19.7% Minnesota...................................................................... 20.3% Utah................................................................................ 21.1% Kentucky........................................................................ 24.3% Wyoming......................................................................... 26.2% Nebraska....................................................................... 26.8% Louisiana........................................................................ 29.9% Michigan........................................................................ 30.3% Delaware........................................................................ 30.5% Hawaii........................................................................... 30.8% North Carolina................................................................. 30.9% Washington..................................................................... 32.7% New Hampshire............................................................... 37.0% California........................................................................ 37.3% Vermont.......................................................................... 39.0% New York....................................................................... 41.3% Connecticut.................................................................... 49.4% North Dakota................................................................... 62.0% Pennsylvania.................................................................. 68.9% District of Columbia.......................................................... 105.6% Illinois............................................................................ 152.3%
To be clear, increased benefit spending has not led to improvements in employee benefits. Most of these cost increases are due to paying down pension debts or changes in accounting rules on retiree health benefits. Teachers should be concerned that rising educational expenditures are not ending up in their pockets but are instead being diverted toward other purposes.While benefit costs were the fastest-rising category of spending, schools are also spending more on student supports (up 14.6 percent in real terms), general administration (up 6.5 percent), and school administration (up 5.7 percent).
There are a couple main lessons here. One is the importance of digging beneath the national numbers. There's quite a bit of variation playing out in the states. But there are also varying trends across categories. And while it's not completely universal, it's worrying that benefit spending, as well as administration and other support services, are eating up larger and larger shares of education spending. If teachers are upset about flat or stagnant salaries in their states, they should start by looking to see whether total education funding has gone up in their community, and then look to see where the money is going.
*Throughout this post, I'm going to be looking at current spending in per pupil, inflation-adjusted dollars. Current spending excludes things like capital and debt costs.
Taxonomy:When most people think about how teachers enter the profession, they might think of what could be called a traditional route--student teaching during college, followed by a full-time teaching job beginning at 22 or 23 years old.
While this is still the typical path into teaching, only about 55 percent of incoming teachers in American public schools start out this way. Twenty percent enter in their late 20s, 16 percent enter in their 30s, and the remaining 9 percent enter after age 40. These data come from a representative sample of American public school teachers surveyed by the National Center for Education Statistics in the 2011-12 school year.
Still, these national data hide quite a bit of variation by state. At one end, Kansas and Iowa teachers are much more likely to take the "traditional" path. In both those states, more than 70 percent of teachers begin their careers by age 25, and more than 85 percent enter the profession at some point in their 20s.
In contrast, states like California and New Mexico have very different patterns. Less than 40 percent of teachers in these states enter the profession by age 25. In fact, New Mexico has the highest percentage of teachers who begin their careers after the age of 40, at 17.6 percent of their teachers.
Age when first started teaching 20-25 26-30 31-35 36-40 41+ National Average 55.0% 19.9% 8.8% 7.0% 9.3% New Mexico 33.7% 23.4% 10.9% 14.5% 17.6% California 39.4% 25.9% 13.8% 8.1% 12.8% Alaska 41.8% 24.3% 13.7% 9.0% 11.1% Rhode Island 43.1% 24.7% 12.0% 7.9%* 12.2% Nevada 44.0% 21.0% 11.8%* 7.1%* 16.1% Arizona 45.4% 21.9% 10.0% 7.5% 15.1% Idaho 46.1% 22.1% 14.0% 8.8% 8.9% Florida 46.2% 23.2% 11.2% 5.8% 13.7% Texas 48.5% 22.6% 7.8% 8.2% 12.8% Hawaii 49.0% 25.7%* 10.3%* 6.8%* 8.2%* Oregon 49.2% 25.1% 8.8% 7.4% 9.5% Vermont 50.2% 22.0% 9.2% 8.9% 9.7% Georgia 51.2% 23.6% 7.4% 8.5% 9.4% Utah 52.0% 23.5% 6.8% 7.3% 10.4% Wyoming 52.1% 26.3% 9.7%* 6.2%* 5.7% Washington 52.2% 21.7% 9.2% 7.3% 9.6% Oklahoma 52.4% 22.4% 8.2% 7.8% 9.1% New Hampshire 52.5% 16.5% 11.5% 8.3% 11.3% Colorado 53.4% 21.4% 9.5% 6.8% 8.8% Maine 54.3% 15.6% 12.2% 10.2% 7.7% North Carolina 55.2% 16.6% 9.5% 9.3% 9.4% Mississippi 55.4% 17.7% 9.5% 7.3%* 10.1% Massachusetts 55.7% 18.4% 7.6% 7.8% 10.6% West Virginia 55.7% 17.2% 9.4% 8.4% 9.4% New York 56.3% 19.2% 9.0% 6.4% 9.1% Kentucky 56.5% 20.7% 9.5% 5.8% 7.5% Louisiana 56.6% 19.3% 11.1% 7.8% 5.3% Tennessee 56.8% 15.1% 11.0% 7.5% 9.6% District of Columbia 56.9% 19.7% 8.5%* 4.9%* 10.0%* Connecticut 57.7% 21.3% 7.9% 5.0% 8.1% Alabama 58.1% 18.8% 9.1% 7.7% 6.3% Virginia 58.3% 15.2% 6.9% 9.0% 10.6% New Jersey 58.4% 19.8% 6.1% 6.9% 8.8% Michigan 58.6% 19.9% 7.1% 8.2% 6.2% Montana 60.7% 17.9% 8.9% 5.7% 6.8% Arkansas 61.0% 17.6% 9.0% 5.9% 6.6% Delaware 61.1% 15.3% 9.4%* 5.7%* 8.5%* Illinois 61.6% 17.0% 8.3% 6.2% 6.9% Minnesota 62.4% 19.5% 6.8% 5.3% 6.0% South Carolina 63.4% 16.8% 8.7% 5.0% 6.2% Missouri 63.5% 18.6% 6.7% 5.8% 5.5% Pennsylvania 63.8% 16.3% 8.0% 5.7% 6.2% Ohio 64.2% 16.0% 7.4% 6.0% 6.4% Wisconsin 65.2% 15.5% 7.4% 5.4% 6.5% Indiana 68.2% 15.7% 6.7% 4.9% 4.5% South Dakota 69.0% 17.5% 5.9%* 3.8%* 3.8%* Maryland 69.7% 13.6% 4.7%* 4.9%* 7.1%* North Dakota 69.7% 15.4% 7.2%* 3.5% 4.2%* Nebraska 69.9% 18.4% 4.7% 2.6%* 4.4% Kansas 70.5% 15.2% 7.0% 3.8% 3.5%* Iowa 71.3% 15.0% 5.7% 4.2% 3.8%* Source: U.S. Department of Education, National Center for Education Statistics, Schools and Staffing Survey (SASS), Public Teachers Data File 2011-12
*Represents small sample size, interpret with caution
This question may be interesting in its own right way, but the answers have financial implications for teachers. Because teacher pension formulas are based on a teacher's salary in the last year they taught, regardless of when that happened to be, those formulas offer greater rewards for late-career service than than they do for the same years performed earlier in the teacher's career. So, for example, the same pension formula would be more beneficial for the typical teacher in California or New Mexico than in Iowa or Kansas, simply because California and New Mexico teachers are already closer to retiring. (See here for a longer explanation with examples for teachers of various ages.)
Teachers who start at younger ages do have the potential to eventually earn larger pensions by the time they retire, but, because they have more years to go, they're also more likely to leave before then. Younger teachers also face different and more difficult calculations about what to do with their pension. For a 35-year-old with 10 years of service who decides to leave the profession, it may make sense to cash out their contributions and roll over that money into an interest-bearing investment account. For someone closer to retirement, the pension may be a better deal.
From a public policy standpoint, it doesn't make a whole lot of sense to prioritize some teachers over others. But that's exactly what teacher pensions do.
Taxonomy:As I wrote about previously, Arizona’s teacher pension system is complex, expensive, and fails to produce an adequate retirement benefit for the majority of its teacher members.
Over the past decade, the problem has been getting worse. The Arizona State Retirement System (ASRS) has simultaneously cut benefits and raised costs for teachers.
An important way to look at the impact of these changes on teacher retirement benefits is to analyze teachers’ retirement benefits net of their own contributions. As we’ve written about extensively, pension systems are back-loaded, which means that for years, often decades, teachers can actually have a net negative retirement benefit (that is, the pension they would qualify for is worth less than what they themselves contributed).
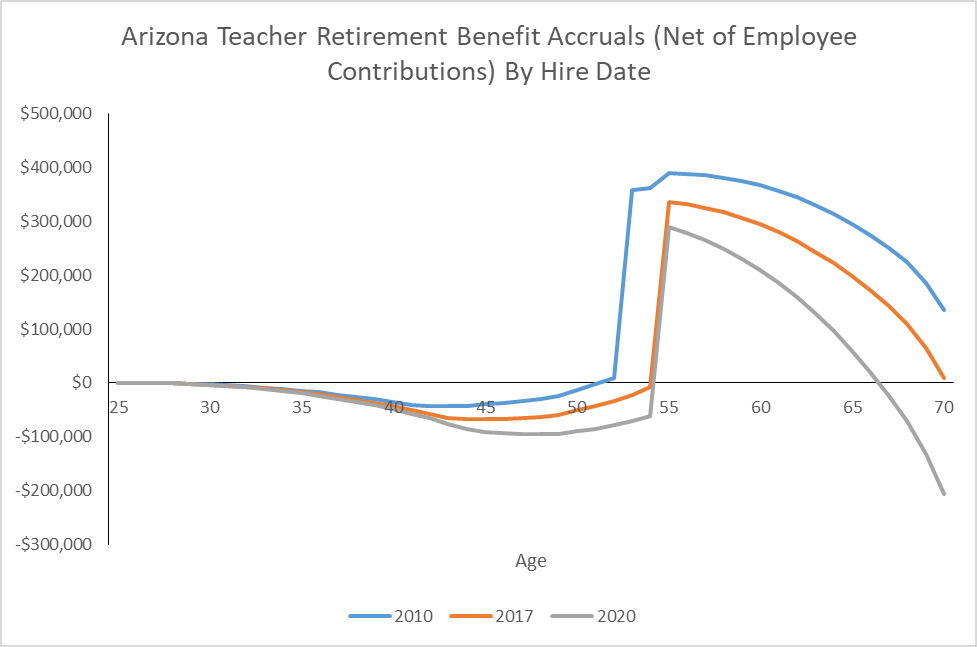
To show how the various changes to the ASRS system affect retirement wealth for Arizona teachers, I modeled how the benefit structure has changed over the past decade. Each curve in the graph below illustrates how benefits would accumulate for a new teacher hired in that year.
As shown in the graph, Arizona teachers’ net retirement benefits have decreased with each change to Arizona’s system. Part of this is due to rising teacher contribution rates, which will go from 9.45 percent in 2010 to 12.51 percent in 2020, according to the state’s projections. Teachers may feel that as a decrease in their take-home pay, but it also means a cut in their net retirement benefits. All told, a new hire in 2020 will have a much less valuable retirement plan than a teacher who was hired in 2010.
Source: Author’s calculations based on ASRS financial reports.
Each line represents a new entrant in a given year. The blue line shows a teacher’s net benefits in 2010. In a set of reforms enacted in 2011, ASRS raised teacher retirement ages and despite a 50-50 split of the total benefit cost, teachers assumed a greater share of the normal cost of benefitis since the employer contribution is mostly going to pay unfunded liabilities. The orange line shows the result of those reforms. The reduction in benefits shifted the curve to the right, while subsequent increases to teacher contribution rates have continued to depress the curve, producing lower net benefits.
Altogether, pension design issues affect how much teachers get out of the plans. Due to benefit cuts and cost increases, teachers are getting less bang for their buck as their net retirement benefit continue to fall.
This problem is not unique to Arizona. States across the country are asking teachers to pay more for lower benefits. But just as teachers in Arizona earned a much-deserved raise last year, they also deserve higher-quality retirement benefits.