Which state has the best (or worst) retirement plan for teachers?
There are lots of ways to answer that question. In the past, we've graded states based on a number of factors, such as how long states require teachers to stay before qualifying for a benefit (aka the "vesting" period), how long teachers would need to stay to qualify for an adequate benefit, and whether the state is keeping its unfunded liabilities in check.
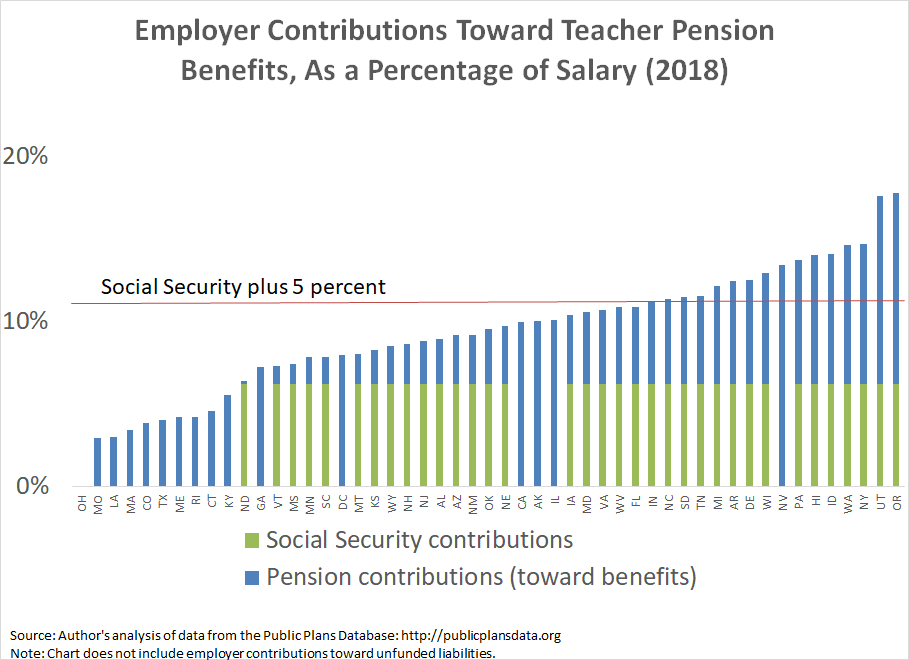
But perhaps a simpler answer is to look just at how much states say they are contributing toward teacher retirement benefits. The graph below plots the results. It adds together each state pension plan's "normal cost" of benefits* plus Social Security contributions. Most experts recommend that employees save 10-15 percent of their salary each year toward retirement, in addition to Social Security. Assuming that employers are responsible for half of that amount, I've included the horizontal red bar as a signal for an adequate employer contribution rate. Purely in terms of contribution rates, 16 states meet this adequacy threshold, while 34 states and the District of Columbia do not.
In fact, while we may take Social Security for granted in the private sector, this chart illustrates just how important it is for teachers. Out of the 15 states plus D.C. that do not offer their teachers Social Security benefits, just one, Nevada, reaches the adequacy threshold.
Another way to say this is that the majority of the worst-performing states are all non-Social Security states. Under Ohio's defined benefit pension plan, for example, teachers are not getting any employer-provided retirement benefits at all. (See here for an explanation of how that's possible.) In fact, 10 states--Ohio, Missouri, Louisiana, Massachusetts, Colorado, Texas, Maine, Rhode Island, Connecticut, and Kentucky--are contributing less toward teacher retirement benefits than most employers are required to contribute to Social Security alone.
In the median state pension plan, employers are contributing 4.5 percent of salary toward teacher retirement benefits. Compared to employer contributions toward private-sector 401(k) plans, that 4.5 percent contribution toward retirement benefits could be consider good but is also not overly generous.
There are a couple other important distinctions here. In a 401(k), an employee's benefit is directly related to their employer's contribution rate. But that's not true under teacher pension plans, where benefits are delivered via formulas tied to the worker's salary and years of service. That is, the employer contribution rates in pension plans are the plan's best guess for how much benefits are worth on average across all employees in the plan. As a result of the way those formulas work, long-serving veterans receive much more generous benefits than short- and medium-term workers. That means some fraction of teachers even in low contribution states will receive adequate retirement benefits. But the majority of teachers, even in higher-contributing states, will earn much less than the plan's average. This is especially true for the most recent generation of teachers, because states have been cutting benefit formulas for new hires. States typically do not report what those averages would look like for different groups of teachers, but the figures would certainly look even worse for new teachers than the averages reported here.
These numbers also rely on each plan's own assumptions for how much its benefits are worth. Those calculations are tied into the plan's assumed rate of return, which many experts believe are too aggressive.
Still, if we take states at their own words, the benefits they're providing are not all that generous, on average. The biggest problems on the benefit side are tied to an overall lack of generosity, an inequitable distribution of how benefits are delivered, and the lack of Social Security in some states. These problems are fixable, but they would require states to think differently about how to structure their retirement benefits so that all teachers received adequate retirement security.
*States break down their pension contributitions into two buckets. The numbers in this post rely solely on the first category of pension contributions, called the plan's "normal cost." Expressed as a percentage of salary, it's the amount of money that the state's actuaries think the plan's benefits are worth, on average across all members in the plan. Although not included here, states are also making significant contributions toward the second category of pension spending, the plan's contribution toward any unfunded liabilities, often referred to as the plan's "amortization costs." For more background on this distinction, see this post. The contribution rate data in this post comes from the Public Plans Data (PPD) from the Center for Retirement Research at Boston College. Note that all figures in this post refer to state-run teacher pension plans. In the case of a state like Alaska, which has closed its pension plan to new workers, the figures reflect the closed plan's benefit levels.