
Everyone knows that teacher turnover rates are rising. So even though they’ve declined a bit recently, over the long term, national teacher turnover rates are up.
But what if the national, composite data aren’t the right way to look at teacher retention?
As I’ve written before, overall teacher retention rates are partly a function of teacher demographics. In general, retention rates for all workers -- teachers included -- follow something of a U-shaped pattern. Turnover rates are high for teachers early in their careers, decline over time and plateau mid-career, and then rise again near retirement. So if you combine all teachers into one overall average, your results will depend on what proportion of teachers fall into each of these career stages.
A better way to think about teacher retention would be to look at how many teachers reach various career milestones. That would allow a cleaner apples-to-apples comparison by looking at teachers who began their careers at different points in time. The National Center for Education Statistics (NCES) runs regular surveys that follow cohorts of teachers for a few years, but there’s no national dataset that I'm aware of that tracks individual teachers over long periods of time.
We can, however, use the NCES data to back into a reasonable approximation. NCES breaks down turnover rates* by teacher experience levels (1-3, 4-9, 10-19, and 20+ years of experience), and they update the data with new survey results every few years. By using these rates and updating them over time, we can synthetically “follow” cohorts as they age into the profession.
For example, NCES’ oldest teacher survey began in 1987-88. In that year, it found that 8.3 percent of teachers with 1-3 years of experience left the profession (meaning 91.7 percent remained). We can assume this group of teachers had the same turnover rate in years two and three (1988-89 and 1989-90). In year four, this group would jump to a new NCES experience category (teachers with 4-9 years of experience). Additionally, NCES released a new set of estimates in 1990-91, so the estimates must shift accordingly.
Using this method, I ran the numbers for the cohorts entering in 1987, 1990, 1993, 1999, 2003, 2007, and 2011. The graph below is the result.
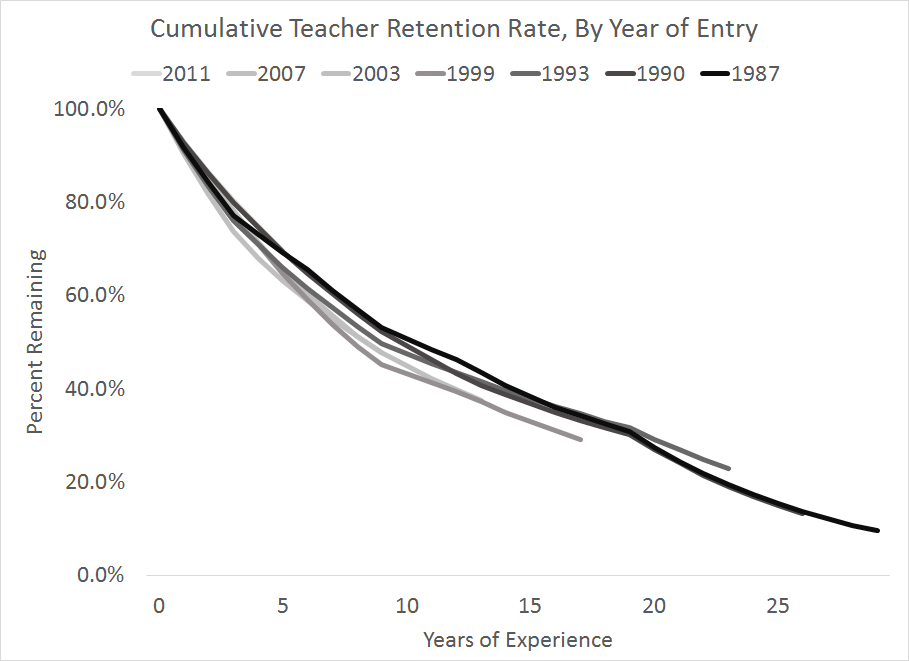
The main takeaway from this analysis is that, contrary to conventional wisdom, teacher retention rates don’t seem to be changing that much.** The national averages appear to be deceiving us. Regardless of the year they started, about one-third of teachers had left within five years, and about half were gone within 10 years. Teacher retention doesn’t seem to be changing that much.
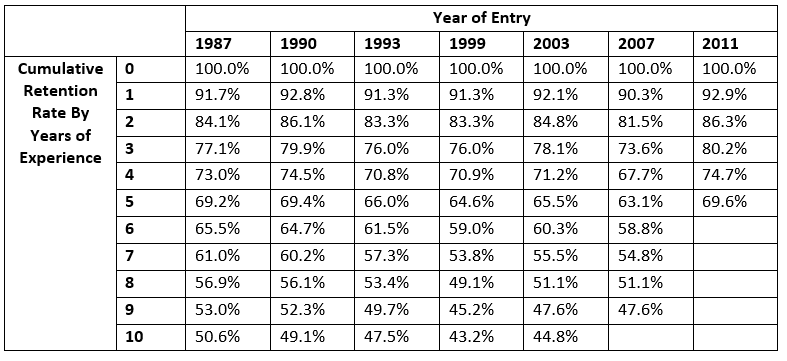
Since the graph is somewhat hard to read, here’s what the data look like in table form. Each column represents a starting year, and the rows indicate the cumulative retention rate by years of experience.
What is really going on here? I suspect two dominant trends have been shaping the national narrative about the changing teaching workforce. First, schools lowered student/teacher ratios by hiring more teachers than they lost. That meant schools were hiring lots of inexperienced teachers, which enhanced the feeling of system-wide churn even as underlying rates of teacher turnover didn’t actually change. Specific policy choices led us to a larger but less-experienced teacher workforce.
Second, even as districts were hiring lots of inexperienced teachers, the teaching workforce also got older. Existing teachers got older as the Baby Boom generation aged into the workforce, and even new hires were older than previous cohorts of new teachers. Due to retirement, older workers have high turnover rates, feeding into the feelings of higher churn.
These two trends could have shifted our perceptions of the teacher workforce even as the underlying dynamics didn’t change much at all. The analysis I’ve presented here suggests that the changing mix of teachers employed in our schools may be deceiving us. Teacher turnover rates aren’t rising, but we are employing more teachers who fall into career stages with high turnover. That's a different, more complicated story.
*For simplicity’s sake, I’m counting all teachers who stay in the profession as being retained. That is, I’m assuming retention is 100 percent minus the NCES “leaver” rate. There’s another group of teachers, “movers” who change schools, but this analysis is looking only at overall, cumulative teacher retention on a national basis.
** There are couple distinctions worth noting. First, the 1999, 2003, and 2007 cohorts all have slightly lower retention rates than prior groups of teachers. The differences aren’t that large—only a few percentage points—but they are visible. I don’t have a good explanation for why those years in particular were lower, but it may have been temporary. The cohort that began in 2011 is more in line with the earlier years and, in fact, has the highest 5-year retention rate of any cohort.
There’s also a visible kink at the 20-year mark. While late-career teachers do have high turnover rates, that’s mainly a function of retirement. They show up here at the 20-year mark due to the NCES categories. Because NCES lumps all teachers with 20 or more years of experience into one category, that captures a lot of teachers who are retiring. The high rates of retirement make the entire category have high turnover rates.
Taxonomy:Earlier this month I talked about teacher pensions on a panel at the annual summit of the Policy Innovators in Education (PIE-Network). In anticipation of the conference, I spent some time pondering my best arguments for why education advocates should invest their time and political capital in pensions, as opposed to everything else they might want to work on (like Common Core, teacher prep, charter schools, school funding, etc).
Although I do a lot of work on pensions, this is an ongoing internal debate for me personally, because I care deeply about these other things as well. So why do I, and why should education advocates, invest in pension reform? This is my argument, in a short PowerPoint form:
For anyone who has questions about teacher pensions or is interested in learning more about pensions in your state, sign up for our monthly newsletter, watch our 3-minute animated "explainer" video below, or reach out to us directly at teacherpensions-at-bellwethereducation-dot-org. We’d love to hear from you!
We know that traditional pension plans can push veteran teachers out of the classroom. But could pension reform draw them back in?
Survey responses released through a Learning Policy Institute analysis of National Center for Education Statistics data, “Solving the Teacher Shortage,” suggest teachers who left the classroom consider the ability to maintain their retirement benefits very or extremely important in their decision to return. So important, in fact, that pensions rank as a bigger obstacle than salary, class sizes, and child care availability. Here’s the breakdown:
The vast majority of teacher pension plans financially incentivize retiring at a set age, often around 60, regardless of an individual teacher’s situation. Inevitably, there are some effective veteran teachers who must then choose between continuing their work in the classroom and literally losing money. The survey respondents seem to capture a piece of this dilemma — teachers who have left the profession but would consider returning, should their retirement benefits allow them to do so.
We’ve discussed this before, but the push and pull on veteran teachers also has an effect on students. Findings suggest that if experienced educators did not face the pressure of a backloaded retirement system with large peaks and valley, but were instead offered a smooth, steady benefit accrual, more teachers would stay in the classroom for longer. This would increase teacher experience levels, and lead to better outcomes for students.
Taxonomy:For some professions, it’s all about: “location, location, location.” For online start-ups, you probably want to be in Silicon Valley. If you want to work on the stock market, head to New York City. But for teachers, where you work doesn’t matter, right?
Wrong.
According to WalletHub’s recent analysis, there is significant variation in teacher job quality from state-to-state.
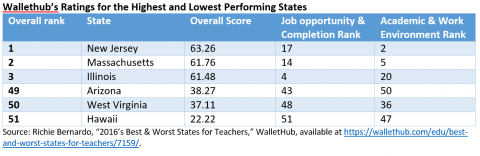
But WalletHub’s rankings shouldn’t be taken at face value. And, as with any aggregate state ranking, the devil is in the details. About 14 percent of their total Job Opportunity & Completion Rank is based on the cost-adjusted “average” teacher pension in each state.
That’s a big problem. Averages can easily distort what’s actually going on.
Evaluating teacher retirement systems based on the average pension is misleading, because the majority of teachers do not even receive a pension. In Washington, D.C., for example, the average teacher pension is extremely high at almost $65,000, but only 29 percent of teachers ever qualify for a pension. So rating D.C.’s pension system on the average benefit of those who remain misrepresents the retirement realities teachers face. Simply put, a state’s average pension value does not provide much useful information about the quality of teachers’ retirement.
There are a couple of ways WalletHub could have evaluated state pension systems more effectively. For example, they could have used a vesting rate. This would grade states on the percentage of teachers that actually qualify for a pension. But even that won’t address other important concerns, such as whether teacher retirement benefits are portable or whether a state’s pension system is financially stable.
In WalletHub’s defense, teacher pensions are complicated. In fact, this points to a larger problem: teachers often lack sufficient information about their retirement. What is the vesting period? Do I qualify for Social Security? What is the retirement age?
The answers to these questions matter.
Most teachers don’t qualify for a pension and around 40 percent of teachers aren’t covered by Social Security. It is unclear how many teachers know these facts. And with many teachers beginning and ending their teaching early in their professional life, it is doubtful that retirement is at the forefront of their minds. Nevertheless, we must do a better job of presenting teachers’ pensions as they actually are: a retirement system that is misaligned with most teachers today.
Taxonomy:It was May of 2012 and, like many other states, Kansas’ state-based teacher retirement plan (part of the Kansas Public Employee Retirement System, or KPERS) was in trouble. Facing a looming $8.3 billion unfunded pension liability, the state’s financial situation looked grim. As a response, legislators voted in a new retirement option, called a cash balance plan, for teachers hired on or after January 1, 2015. Below, we take a look at what the plan offers, and how it's worked out a year and a half later. Here's the breakdown:
What is a cash balance plan?
A cash balance plan is a hybrid, combining aspects of a defined contribution, 401(k)-style retirement plan within the format of a defined benefit plan, like most pensions. Individual employee retirement balances are stated in terms of an account balance, rather than a formula, but the employer takes responsibility for investing the assets and guarantees at least a minimal level of return on those investments. Kansas isn't alone in adopting this format. We've covered a similar cash balance plan in California, which offered most workers a better deal than the state's existing pension plan, and Nebraska's version has been lauded by both Pew and The New York Times.
How does it work?
In Kansas, enrolled employees automatically contribute six percent of their salaries to the plan, and the state then invests the money and guarantees at least 4 percent annual interest. This guaranteed interest rate sets the cash balance plan apart from retirement plans like 401ks where workers are left on their own to invest and are subject to the ups and downs of investing in the stock market. In addition, teachers also earn retirement credits, based on a percentage of salary and years of service. These credits are earned quarterly, and the credit rate increases the longer a teacher works. The table below, created by KPERS, breaks this down further.
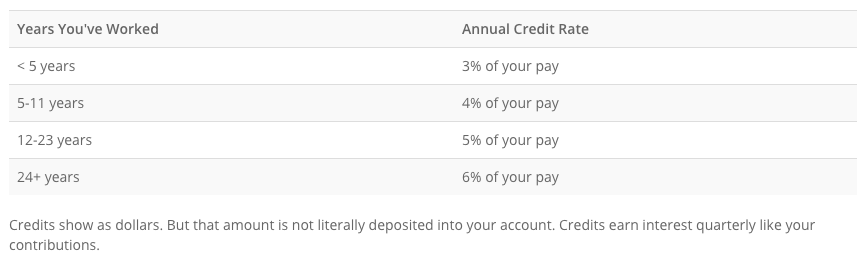
While these retirement credits, like traditional pensions, are available only at retirement, employees can withdraw their own contributions plus that promised interest should they leave employment.
Why is this particularly relevant in Kansas?
Sweeping income tax cuts were the cornerstone of Governor Sam Brownback’s re-election campaign, and his financial experiment has left the state’s budget gutted. While the vast majority of states would benefit from public pension reform, Kansas’ need is all the more pronounced. The cash balance hybrid plan is a step in the right direction, but more work needs to be done.
Where are they now?
Well, the cash balance plan didn't solve everything. This time last year, lawmakers voted to shore up the pension fund using a $1 billion bond; the bond has a roughly 4.7 percent interest rate, while the state is assuming they can invest that money and earn 8 percent interest. But in fact, KPERS officials reported that the fund earned just 0.2 percent during 2015 — a far cry from the 8 percent rate the state assumed. But that's not all. Last fiscal year, lawmakers also delayed a $100 million quarterly KPERS payment. They now have until June 30, 2018 to make the payment, plus the same 8 percent interest on that money. State legislators from both parties have expressed skepticism that even this delayed deadline will be met.
The traditional pension plans (KPERS 1 and 2), as well as the newly created cash balance plan (KPERS 3), are all paid from the same budget. The progress made in adopting a cash balance plan is commendable, but, unlike a 401(k) plan, it allows the state to continue to delay contributions. While it's unlikely, Kansas would run into trouble if enough KPERS 3 employees decided to leave the profession or move out of state, demanding their contributions plus the promised interest in the process. Kansas is making progress, and moving to a new pension plan might very well be good for new workers. At the same time, it hasn't solved all of the state's budget woes.
The post below was originally published on June 5, 2015, and has been updated to include the most recent data.
The Census Bureau’s annual Public Education Finances compiles total education spending and revenue across the entire country. The latest data, released earlier this summer, shows teacher benefits continue to eat away at school budgets. (The new data tell a similar story as our recent Pension Pac-Man report.)
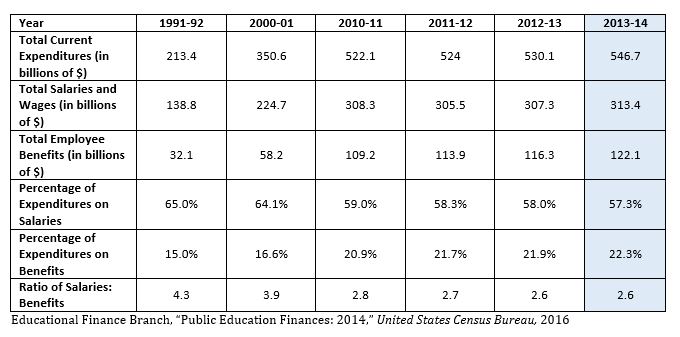
Public school expenditures have more than doubled since 1992 (including inflation), and the percentage of those funds spent on teacher benefits has increased as well. The percentage spent on teacher salaries, however, has dropped. The table below captures various education expenditures* by all public schools across the country over time.
Employee benefit expenditures include costs such as retirement plans and health insurance. School district expenditures on benefits leapt nearly 110 percent since the early 2000s, and climbed steadily over the past four years as well, now taking up over 22 percent of school district spending. Spending on salaries increased by just 39 percent during this same window.
As a share of total expenditures, benefits are also increasing; they now eat up roughly 6 percentage points more than in 2001. Over the same time period, the percentage spent on teachers’ day-to-day wages has declined, down almost seven percentage points since 2001.
The changing ratio of salaries to benefits is troubling. Increasing spending on benefits saps already limited funding, and prevents districts from taking on new teachers or rewarding experienced ones with raises. A low starting salary can also serve as a deterrent to those considering the teaching profession and could potentially keep talented new graduates from pursuing teaching roles.
*Note: Data do not include capital costs or debt, just current spending