A Ponzi, or pyramid, scheme depends on constantly having new people come in at the bottom to prop up the top.
Theoretically speaking, teacher pension plans are not Ponzi schemes. Beginning in the 1970s and 1980s, states recognized that they needed to save for the pension promises they were making. If everything went according to plan, they wouldn’t have to rely on new members to fulfill those promises.
Unfortunately, many teacher pension plans have become Ponzi-like because of the way they’ve been managed. As I showed in the first installment of this series, teacher pension plans have amassed $800 billion in pension debts, thanks in large part to underestimating how much they needed to save and overestimating how fast their investments would grow.
In response, states have raised employee and employer contribution rates, effectively reducing the take-home pay for active teachers while also cutting into the discretionary budget districts have to pay them.
States have also cut benefits for new members. As extreme examples, newly hired teachers in Illinois and Ohio are now receiving a negative retirement benefit — on average, they will contribute more of their own money than they’ll ever get back in benefits.
Like Ponzi schemes, teacher pension plans also assume that new members will continue to be added to the system as it grows over time. But what if those assumptions are no longer correct? What if membership numbers start to flatline or even decline?
Student Enrollment Is Falling
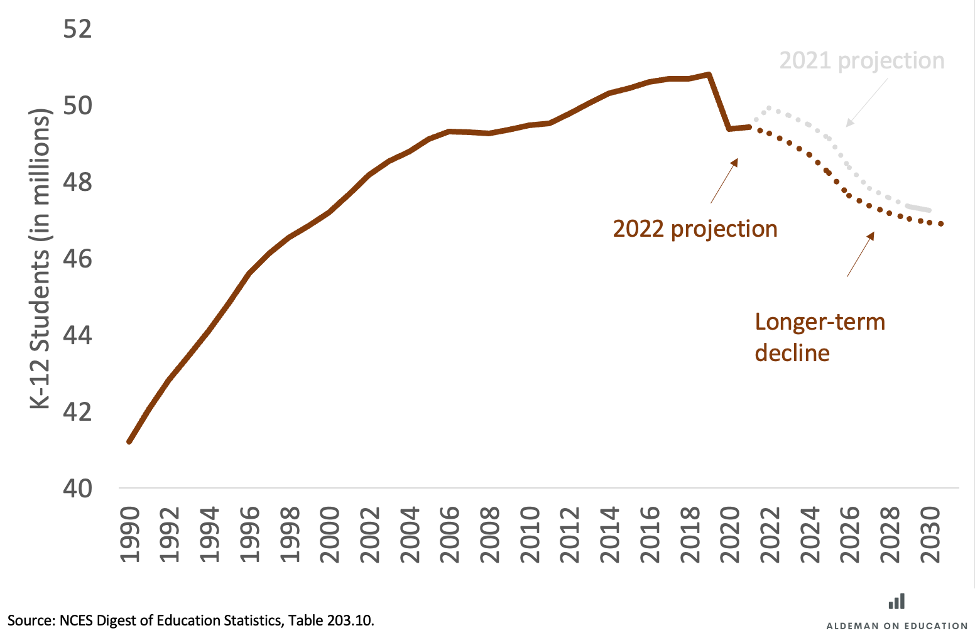
The school closures in the wake of the COVID-19 pandemic led to an immediate decline of 1.4 million public school students (a 2.8% decline). This stemmed from a number of factors: a rise in homeschooling, a shift to private schools, kindergarten delays, and some students who were simply missing.
It may sound crass, but pension plans are concerned about their membership, not students. And thanks to the combination of rising state budgets and a one-time infusion of $190 billion in federal funds, district budgets have remained strong and the lower student enrollment has not translated into a meaningful decline in pension plan membership. The 10 largest teacher pension plans ended the 2021-22 school year with a combined 1,480 fewer members than they had at the same time in 2019, a decline of just 0.05%.
But the disconnect between student enrollment and pension system membership can’t last forever. State budgets are starting to plateau, and the federal money will run out in September of next year. Meanwhile, enrollment is projected to continue falling. Lower immigration and declining birth rates will cause student enrollment to fall through the rest of the decade. The National Center for Education Statistics now projects that public schools will lose an additional 2.4 million students (4.9%) between now and 2031.
Figure 1: After Decades of Growth, Public School Enrollment Is Now Falling
Enrollment changes will vary quite a bit from state to state. Thirteen states — including Florida, North Dakota, and Idaho — are actually projected to serve more students by the end of the decade.
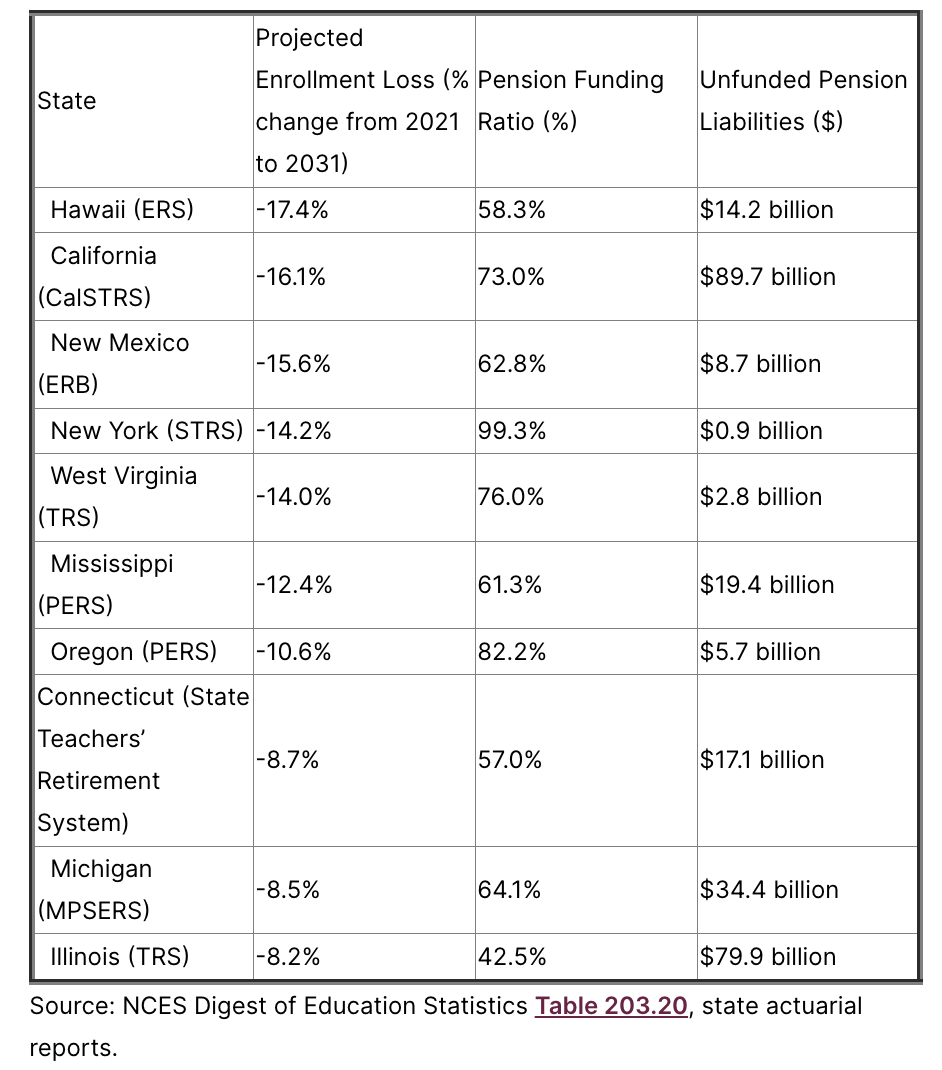
But in states facing steep enrollment declines, pension plans might be in real trouble. Table 1 below shows the 10 states with the largest projected student enrollment declines through 2031. Except for New York, which has managed to keep its pension debt costs in check, these states have dug themselves a large pension hole.
Table 1: States With the Largest Projected Enrollment Declines
It’s possible that pension plan membership will continue to grow even as student enrollment falls. But that would largely depend on state taxpayers being willing to support continued reductions in student-teacher staffing ratios.
If schools instead adjust their staffing levels to reflect student enrollment declines — well, then, watch out. Pension plans will have to pay off their existing pension debts on the backs of a shrinking pool of active workers.
Pyramid Schemes (Eventually) Collapse
At some point, Ponzi schemes collapse because there aren’t enough new entrants.
Teacher pension plans won’t collapse because their promises are backed by state taxpayers. But over time they’ve become a bigger and bigger financial strain on state and local education budgets. That trend shows no sign of slowing down. More funding going toward pension debt means less going to teacher salaries, classroom resources, building maintenance, and many other investments teachers and families care about.
So what can state legislators do? The specific details will vary by state, but I’d recommend four principles to help state leaders responsibly pay down their pension debts while mitigating the effects of enrollment declines:
1. Keep promises to current workers and retirees
Workers and retirees are not to blame for today’s pension problems. They didn’t create the pension formulas, set the contribution rates, or skip any payments — state leaders did. Pensions are a promise, and states should keep them. Besides, in many states, it would be illegal to change benefit rules for existing workers or retirees. State leaders need to look elsewhere for solutions.
2. Don’t pass the problem on to districts
School district leaders didn’t create these pension problems, either, and they shouldn’t have to pay for debt they didn’t incur. Plus, states have a larger and more equitable tax base than local communities do. As such, the state should bear the full responsibility for paying off pension debts.
3. Actually pay down pension debts
This one might seem obvious, but many states are using financial wizardry to hide the true cost of their pension plans. Some make overly aggressive investment assumptions to justify contributing less than they should. Others roll over their pension debts year after year in a process akin to paying the minimum payment on a credit card while letting the total balance grow over time.
These types of shenanigans can lead to “negative amortization,” in which pension plans slowly build up debt without making any progress on the principle. That helps keep costs (artificially) low in the short run but will cause even worse problems if (when?) membership starts to decline.
States should instead adopt more honest funding practices to ensure they can meet their obligations to workers and retirees. Once they commit to a funding plan, they should seek out a dedicated source of revenue — such as bonds, a special tax on millionaires, or “sin” taxes on marijuana or gambling — to pay down their debts over time.
4. Guarantee a path to a secure retirement for all workers
Traditional pension plans are “guaranteed” in the sense that the promises are backed by taxpayers. But workers are not guaranteed to benefit. Because of the way the formulas work, the majority of new teachers don’t stay long enough to qualify for any benefits, let alone good ones.
Instead, states should consider cash balance plans, hybrid plans, or even well-structured defined contribution plans that put all workers on a path to a secure retirement, no matter how long they remain as teachers.
These types of alternative plan designs are better for workers. Taxpayers would benefit, too. We all benefit when more workers have access to high-quality retirement plans rather than being dependent on social insurance programs. These plans also reduce or eliminate the chance of adding to the state’s pension debts going forward. Rather than using education budgets to pay for the mistakes of the past — as they are increasingly doing today — all of the money set aside for education could go to current workers, programs, and services.
If policymakers follow these steps and respond to rising pension costs, they can help teachers and ensure that more money intended for schools makes it into classrooms.
Taxonomy:In the early days of the COVID-19 pandemic, there were fears of a massive wave of teacher retirements. After all, older people were and remain more susceptible to the virus, and it seemed reasonable to expect that older teachers might have experienced a rougher transition to remote learning.
It didn’t play out that way. In fall 2020, most schools across the country stayed closed, which took the immediate health risks off the table. When Alex Spurrier and I looked at the retirement numbers available that fall, we found they were mostly down.
Speculation, combined with bad data, continued to perpetuate the teacher retirement narrative nationally. For example, in February 2021, the California State Teachers’ Retirement System (CalSTRS) wrote a blog post noting that midyear retirements were up by 26% over the same period the year before. Media outlets warned that, if trends continued, teacher retirements could hit “record-breaking heights.”
Did the trends hold?
They did not. Pension data are slow, but when it eventually released its official, full-year data, CalSTRS reported that the number of retirements for the fiscal year ending June 30, 2021, was nearly identical to the number for 2018 (see Table 6 of its actuarial report).
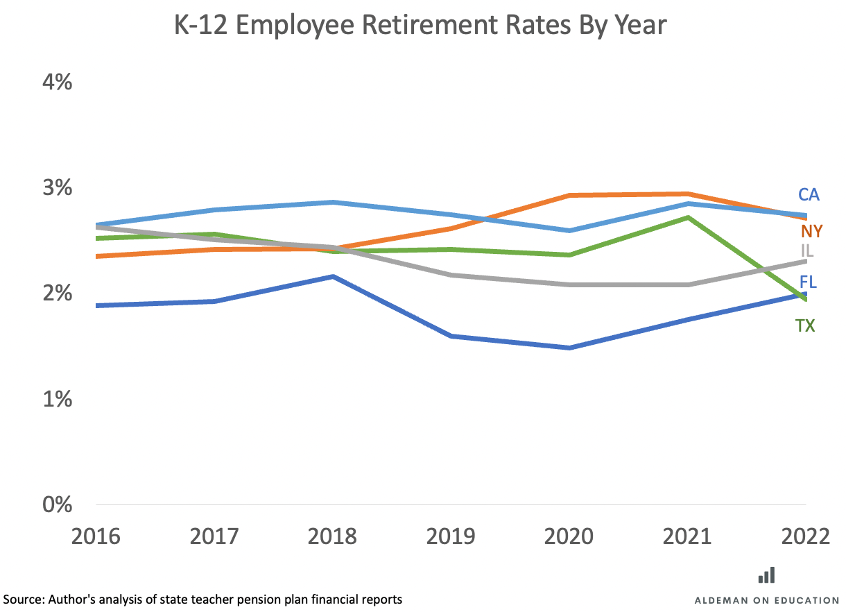
In fact, retirement rates across the largest teacher pension plans in the country have remained relatively stable over the course of the pandemic. Figure 1 below shows state trends for the five largest pension plans covering teachers. Although there is some evidence of a dip in 2020 followed by an uptick in 2021, there’s no clear pattern across all five. There’s certainly nothing pointing to a massive surge of retirements.
Figure 1: There Has Been No Surge in Retirements From the Largest “Teacher” Pension Plans
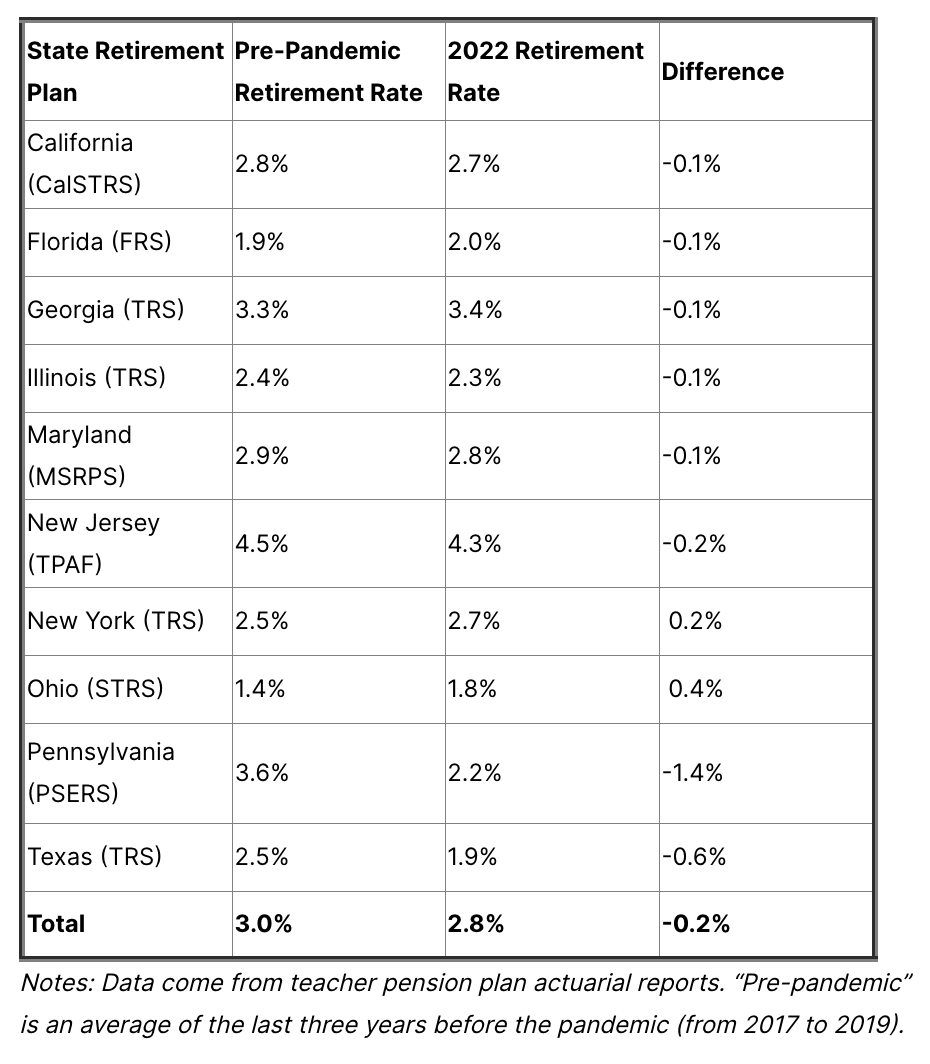
Table 1 takes this a step further, comparing the latest retirement rates with pre-pandemic averages for the 10 largest pension plans serving teachers. Six had a lower retirement rate in 2022 than they did in the three years leading up to the pandemic — and the total retirement rate across all 10 plans is down, not up.
Notes: Data come from teacher pension plan actuarial reports. “Pre-pandemic” is an average of the last three years before the pandemic (from 2017 to 2019).
These data illustrate why it’s important to look at retirement rates rather than raw numbers. As COVID-19 should have taught us, raw numbers might sound scarier, but denominators matter because they put things in context. CalSTRS, for example, had 12,785 new retirees in 2021. But that number doesn’t mean much without knowing that CalSTRS had 448,419 active members at the time. Dividing the number of retirees by the number of active members works out to a retirement rate of 2.9%.
Putting the Retirement Rates in Context
What to make of the generally flat trend in teacher retirements at the same time reporting shows teacher turnover rates rose last year in a number of states?
First, it’s hard to pin down the exact retirement numbers for classroom teachers versus other types of education workers. For example, CalSTRS is officially the “teacher” retirement system of California, but it also includes other types of education employees. That’s true in other states, too: In Florida, for example, teachers are in the same retirement plan as other non-education state and local government employees, and the state pension plan does not report disaggregated results by role.
Turnover can also vary across many dimensions. For example, some states may be experiencing increases in turnover among early-career teachers even as turnover among retirement-age teachers holds steady — a question worth exploring. And at least one state, Arkansas, has seen a statistically significant 7% increase in turnover among teachers age 55 or older. But even if other states saw similar increases among older workers, that level of change may not be big enough to meaningfully affect the overall retirement numbers since retirement-eligible veterans make up a relatively small share of the total teacher workforce.
Why Are Teacher Retirement Rates So Stable?
About 90% of public school teachers are enrolled in defined-benefit pension plans, with guaranteed retirement benefits based on the worker’s years of experience and age. These plans offer predictable, assured benefit payments regardless of external factors. In addition, about two-thirds of public school teachers serve in states or districts that provide health care benefits to eligible retirees. The combination of retirement benefits plus health insurance means that veteran educators are in a relatively stable position financially.
Research has found that these structural factors make a difference. Veteran teachers are aware of their pension benefits and time their retirements accordingly, even if they no longer enjoy teaching. Because of the way the benefit formulas are structured, pensions can also push out veterans who might otherwise prefer to keep teaching.
Regardless of how highly you value stability over these other factors, the available evidence suggests that teacher retirements have been proceeding normally, even amid a pandemic.
Taxonomy:It can be hard to get a handle on teacher retirement costs. Collectively, states and school districts spend about $63 billion a year on employee retirement benefits, but what does that mean for individual school district budgets? How do these figures translate into per-pupil or per-teacher terms?
On average, I estimate the largest 100 school districts in the country are spending $1,549 per student on teacher and other employee retirement costs. However, as an earlier post in this series showed, this number is largely driven by “pension debt” costs — the promises that states made in the past but never properly saved for. Large school districts are devoting only about one-third of their retirement costs to benefits for today’s employees, with the rest going toward pension debt costs.
Are these numbers big or small? They vary widely across the country. But to put the national totals into perspective, the amount schools are spending on pension debt is roughly on par with the per-pupil cost of providing small-group tutoring services.
The analysis below explains how pension costs translate into per-employee and per-student estimates at the district level. The Methodology section at the end describes how I came up with the estimates and why we don’t have better answers to these questions in the first place. The Appendix has the detailed results for each of the 100 largest school districts.
Pension Costs for Individual Employees
The starting point to understand school district pension costs is to look at contribution rates.
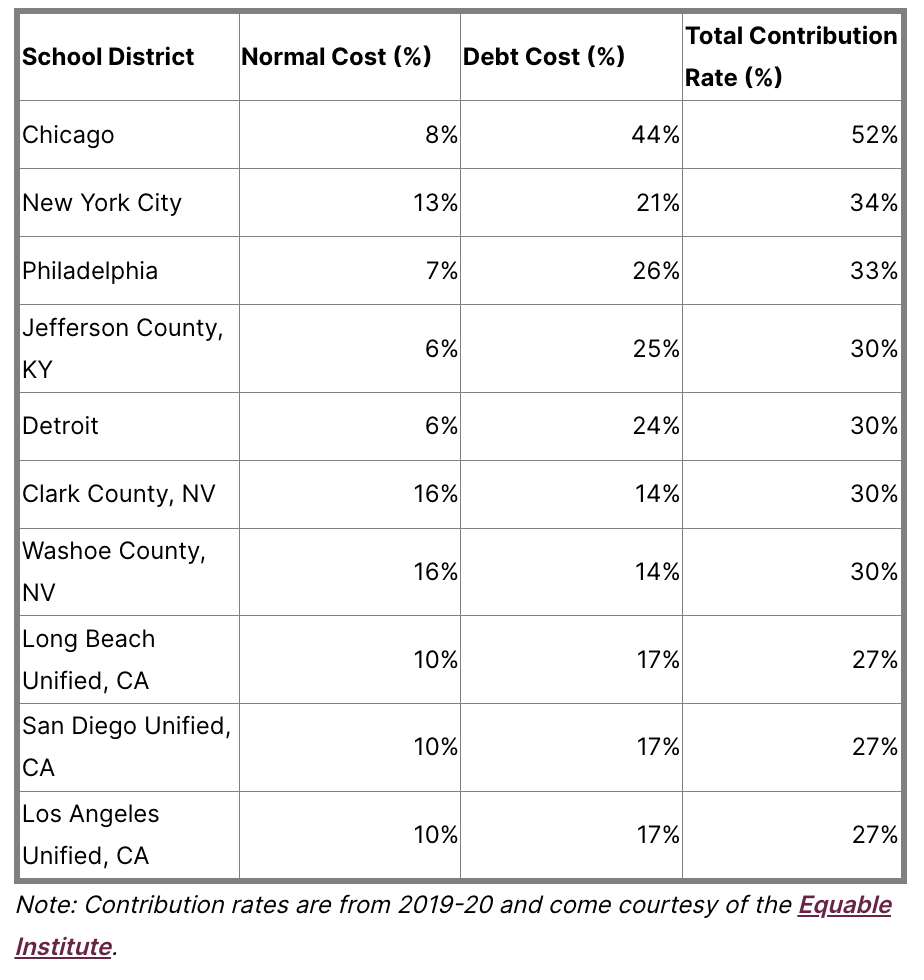
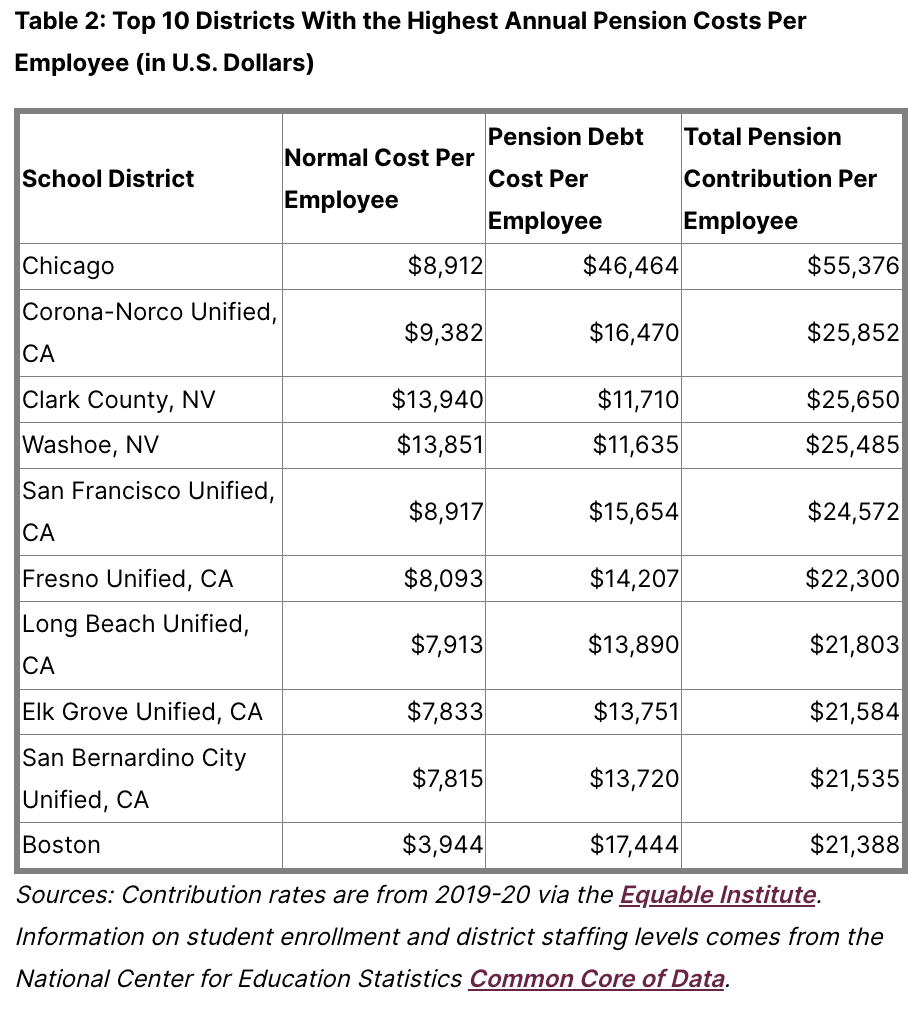
A contribution rate is expressed as a function of salary. For every $1,000 a district pays in salary, how much will it have to contribute to the pension plan? Table 1 shows the 10 districts in the sample with the highest required contribution rates.
At the top of the list is Chicago, with a required contribution rate of 52%. For every $1,000 Chicago agrees to pay in salaries, it also needs to budget $520 in retirement contributions.
Table 1: Top 10 School Districts With the Highest Teacher Pension Contribution Rates (%)
Chicago teachers won’t ever get that money directly as compensation; it goes to the pension fund. But how does this money translate into benefits for retirees?
Pension plans break down their costs into two buckets: what pension actuaries call the “normal cost” or the estimated cost of the retirement benefits active workers earn that year, plus any unfunded liabilities.
Chicago is budgeting for an 8% contribution toward the normal cost of benefits. It’s comparable to what a private-sector employer might contribute to a 401(k) plan, but it differs in several respects. Pension benefits are derived from a formula that rewards longevity. The longest-serving veteran teachers in Chicago can expect retirement benefits worth more than that 8%, but most workers will get less.
On top of that, Chicago school district employees are part of the 40% of teachers nationwide who do not participate in Social Security. Whereas employers in the private sector make 401(k) contributions on top of the 6.2% Social Security tax, Chicago doesn’t have to make that contribution, and employees don’t get credit toward their Social Security benefits.
Defined benefit pension plans like the one in Chicago can also build up unfunded liabilities, or pension debt, if any of its estimates are wrong, if investments are less than expected, or if contributions in the past were insufficient.
Chicago has accumulated a lot of pension debt. As a result, it now must pay a whopping 44% of each employee’s salary each year just to pay down those unfunded liabilities.
Chicago is an extreme outlier, but the majority of large districts are paying more in pension debt costs than they are in normal costs. Only six big-city districts — Milwaukee; Washington, D.C.; Mesa Unified in Arizona; Clark and Washoe counties in Nevada; and Seattle — are paying more for benefits than they are for pension debts (Appendix, Table 1).
How do these contribution rates translate into pension costs per employee? Table 2 shows the districts in the sample with the highest total retirement costs per employee.
At $55,376, Chicago again leads the country, and it’s not particularly close. It “wins” the prize thanks to both a high average salary per employee (more than $106,000 a year) and a high contribution rate (as discussed above) on those salaries.
Table 2: Top 10 Districts With the Highest Annual Pension Costs Per Employee (in U.S. Dollars)
The next-highest district on the list is Corona-Norco Unified in California. It is paying the equivalent of $25,852 on behalf of each employee toward the state pension plan. Only about one-third of that is going to benefits for active employees, though; the remaining $16,470 is going to pay down the state’s unfunded pension liabilities.
Notably, none of the districts on this list participates in Social Security. Compared to states that offer employees both a pension plan and Social Security, the pension plans in non-Social Security states tend to cost more and be in worse financial shape.
On average, the 100 largest school districts are paying the equivalent of $8,670 per year in pension debt for every employee. That money is being spent on behalf of teachers and other employees, but it won’t ever go into their pockets. It represents billions of dollars that might have been available to raise teacher salaries in these districts if state legislators and governors had responsibly funded their pension promises in the past.
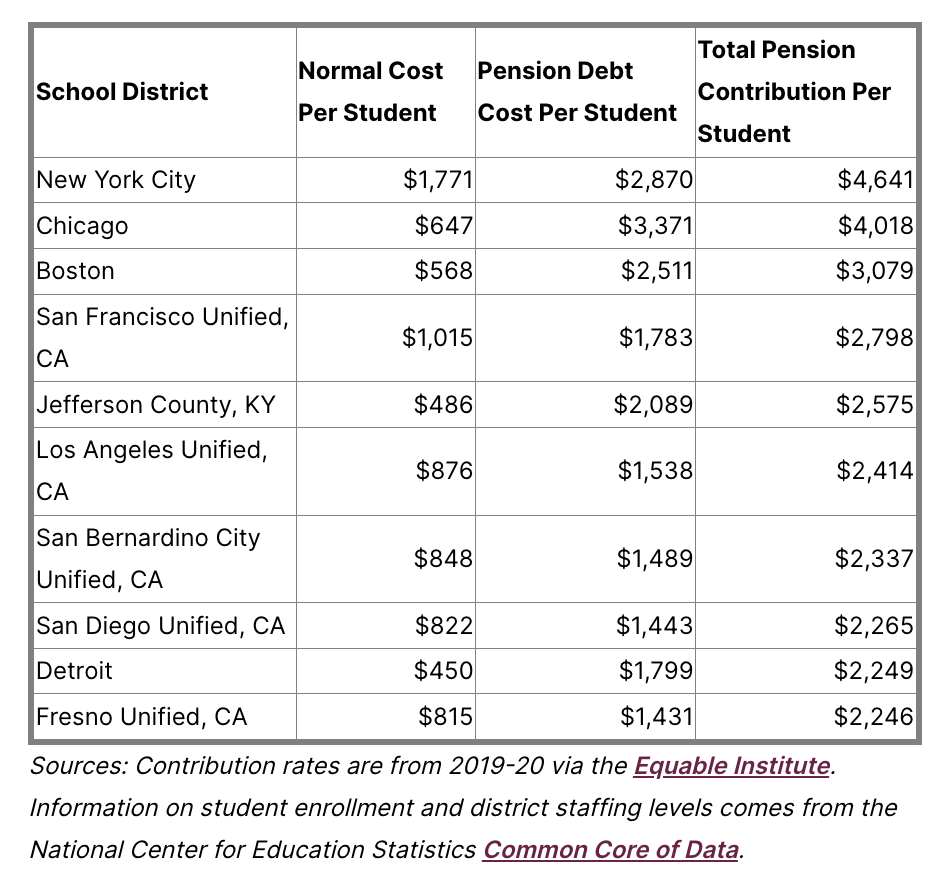
Pension Costs Per Pupil
There’s a growing body of research showing that spending more money on education boosts academic outcomes and long-term career trajectories for students, especially low-income students. That makes sense if higher spending is translating into more instructional aides, higher teacher salaries, or better facilities. But is more money for education helpful to students if it’s invested in paying down pension debts? Likely not.That’s why it’s important to also look at pension costs in per-pupil terms. The 100 largest districts are spending an average of $1,549 per student per year on pensions. Those range from a low of $420 per student in Shelby County, Tennessee, to a high of $4,641 in New York City (Table 3).
Table 3: Top 10 Districts With the Highest Per-Pupil Pension Costs
Again, most of the investment is not going toward compensation for educators supporting today’s students: About two-thirds ($1,002 per student) is going toward pension debt costs. That amount is roughly on par with estimates of the per-pupil cost of creating a dedicated corps of tutors to support students.
In the absence of pension debts, it’s hard to definitively prove whether districts would spend their money on tutoring or raising teacher salaries or any other specific activity. But research suggests that higher pension costs translate into fewer teachers and can crowd out spending on things like school facilities and textbooks.
States Have a Responsibility to Act
District leaders are often responsible for paying the pension bill and are the ones who feel the tightening in their discretionary budgets as a result. But, ultimately, pension problems are state problems. State legislators set the rules for teacher retirement benefits, and they decide — directly or indirectly — how much to contribute to the plan each year. Their choices create debt obligations that filter down to districts.State leaders may want to engage their labor groups on this pension squeeze, and on whether workers would prefer compensation in the form of salaries or benefit promises. In a vacuum, employees will say they want higher salaries and better benefits — until they understand the financial trade-offs and options available to them.
Individual teachers may also have different preferences. Rather than offering only one retirement plan for all 8 million public education employees, more states could offer K-12 employees a choice over their retirement plan. For example, many states offer retirement benefits for higher education employees that are both more generous and more flexible than what’s offered to K-12 workers. Offering different types of retirement plans could help states constrain costs while making individual employees happier.
But the first step is to understand and acknowledge the problem. Accumulated pension debts cannot be ignored or wiped away. Millions of active and retired workers are depending on their promised benefits. State leaders could start by treating teacher pension debts just like all other long-term state obligations and coming up with a responsible plan to pay them down over time.
Check out the Appendix to find the pension cost burden for individual cities.
Appendix: Methodology, Terms, and Sources
Access Appendix Table 1: School District Retirement Costs (2019-20)I set out to estimate how much school districts spend on teacher and other employee pension costs. There are other attempts to answer similar questions, but those are national rather than local, don’t break out information by the normal cost of benefits versus the cost of unfunded liabilities, or lump pension spending in with other benefits. The methodology I came up with here is certainly not perfect, and there are some sources of error that I’ll discuss. Anyone looking for a precise number for a given district should consult with the district finance office. As such, the numbers here should be treated as plausible estimates rather than precise budget amounts.
For the purposes of this piece, I’m using what are known as actuarially required contribution rates. In some places, an employer might pay less than what’s actuarially required, but the actuarial rate is the amount the plan believes it needs to stay solvent.
I’m attributing all “employer” contribution rates to a given school district, but in some places, the state pays some or all of the “employer” contribution rate. In those cases, I’m attributing spending to a district that comes from the state, so the estimates here should be interpreted more as “spending attributable to a district” rather than “spending that directly comes out of a district’s budget.”
The data on contribution rates are from 2019-20 via the Equable Institute. At times I use the word “pension,” but the data also include contributions toward defined contribution or other state-provided plans. Other than a few citywide plans, such as those in New York City; Kansas City, Missouri; and St. Louis, Missouri, I applied the statewide “teacher” plan contribution rate across all of a school district’s employees. That miscounts some employees who may be covered by a different plan, but plan participation data is not available at that level of detail.
Information on student enrollment and district staffing levels come from the National Center for Education Statistics Common Core of Data. Because the 2019-20 staffing counts were missing for some districts, I used a multiyear rolling average of all staff. I use the term “teacher” throughout the piece, but the data include and are applicable to all school district employees, including but certainly not limited to classroom teachers.
Taxonomy:School districts are paying more money for teachers. Meanwhile, teachers are receiving less money as income.
How is this possible?
The difference comes down to retirement costs and the large unfunded “pension debts” that states have accumulated, creating a massive disconnect between teachers’ total compensation and their actual paychecks. As policymakers attempt to raise teacher salaries, their efforts will fail unless they act to rectify the compensation-versus-salaries disconnect.
This problem matters for school leaders and state policymakers because it means they’re buying less teacher labor for every dollar they invest — and that efforts to raise teacher salaries will fail or be far less successful than state and federal leaders are proposing.
It matters to teachers, who feel it in the form of reduced paychecks. Teachers struggle to buy food, pay their mortgage, or send their child to day care using compensation from pension debt payments.
And it matters to students because so many of the dollars being invested in their education aren’t making it into classrooms. While per-pupil expenditures have risen substantially over time, much of that new investment ends up paying for the pension debts accumulated in the past.
This piece will walk readers through three graphs. The first two use data from a Bureau of Labor Statistics (BLS) survey called the Employer Costs for Employee Compensation. The survey findings allow us to see how teacher compensation is changing, overall and by component. School districts are facing higher costs to employ teachers, even as teachers are receiving lower salaries.
The main cause of this disconnect is not new taxes or teachers getting more paid time off. It’s also not rising health insurance premiums. Instead, it’s all on the retirement side: Teacher salary costs have risen 44% since 2004, while retirement costs have risen by 322%.
Unfortunately, data from the Equable Institute show that these growing retirement costs are not benefiting workers. In fact, states have been cutting benefits for workers even as they face rising costs, thanks to negligence in how they fund their teacher pension plans. States collectively now face more than $800 billion in unfunded pension liabilities. These pension debt costs are crowding out other potential investments in education.
This analysis is the first in a series of policy considerations for how states can get their pension debts under control and start directing more money into teachers’ pockets.
The Growing Disconnect Between Salaries and Total Compensation
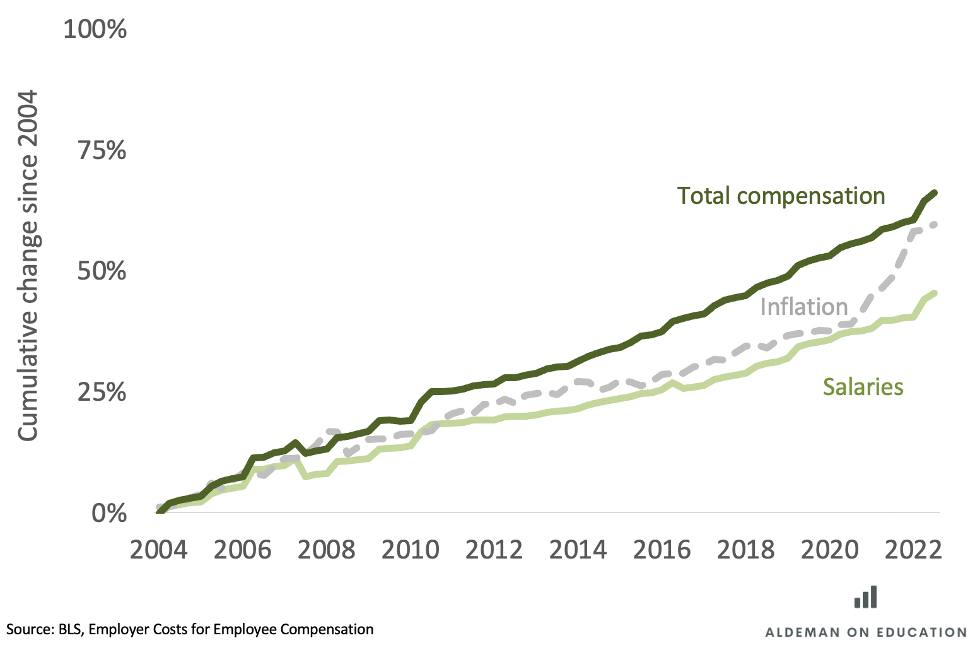
The BLS survey on Employer Costs for Employee Compensation has been tracking compensation data since the 1980s. For most of those years, it lumped together all “teachers,” including those at private schools and postsecondary teachers. But starting in 2004, it began to break out data separately for “primary, secondary, and special education school teachers” who work in the public sector. The data allow us to see how K-12 public school teacher compensation has changed over time (Figure 1).
Teacher salaries (light green) have risen in nominal dollars, but they have not kept up with inflation (gray dotted line). Especially as inflation has risen rapidly in recent years, teacher salaries have not kept up.
The same trend is broadly applicable across the American workforce. Salaries tend to be “stickier” than inflation, and it takes time for salaries to catch up — particularly when inflation rates quickly change. That is especially true for workers in the public sector, where salaries are set in contracts that might only be negotiated every two or three years.
Figure 1 also shows how total teacher compensation is changing over time. This reflects the full amount that school districts are paying to employ a given teacher — not just salary but also paid time off, supplemental pay, taxes, and benefits like health insurance and retirement. As the chart shows, the total compensation package of public school teachers has outpaced inflation. School districts are paying more, while teachers are getting less.
Figure 1: Teacher Salaries Are Not Keeping Up With Inflation, but Total Compensation Is
Another way to look at this trend is to consider salaries as a portion of a teacher’s total compensation. Over this time frame, salaries shrunk from 74% to 65% of the average teacher’s total compensation.
The Cause of the Disconnect: Retirement Costs
So what’s driving the total compensation-versus-salaries disconnect? It’s mainly retirement costs. The BLS survey breaks down total compensation into six categories:
- Ordinary salaries and wages.
- Benefits, including paid leave.
- “Supplemental” pay for work outside the regular day.
- Taxes and other legally required benefits (including Social Security and Medicare).
- Insurance benefits.
- Retirement benefits.
For public school teachers, supplemental pay makes up the smallest percentage of their total compensation, at just 0.4%. Taxes and paid leave each consume about 4.5% of compensation, and those percentages have not changed much over time.
Health insurance is largely a success story. Like other employers, school districts had rapidly rising health insurance costs leading up to the 2010 passage of the Affordable Care Act. But since then, costs are rising much more steadily. School district health insurance costs rose by 6.7% per year from 2004 to 2010. From 2011 to 2022, they rose by only 2.2% per year, less even than the rate of inflation.
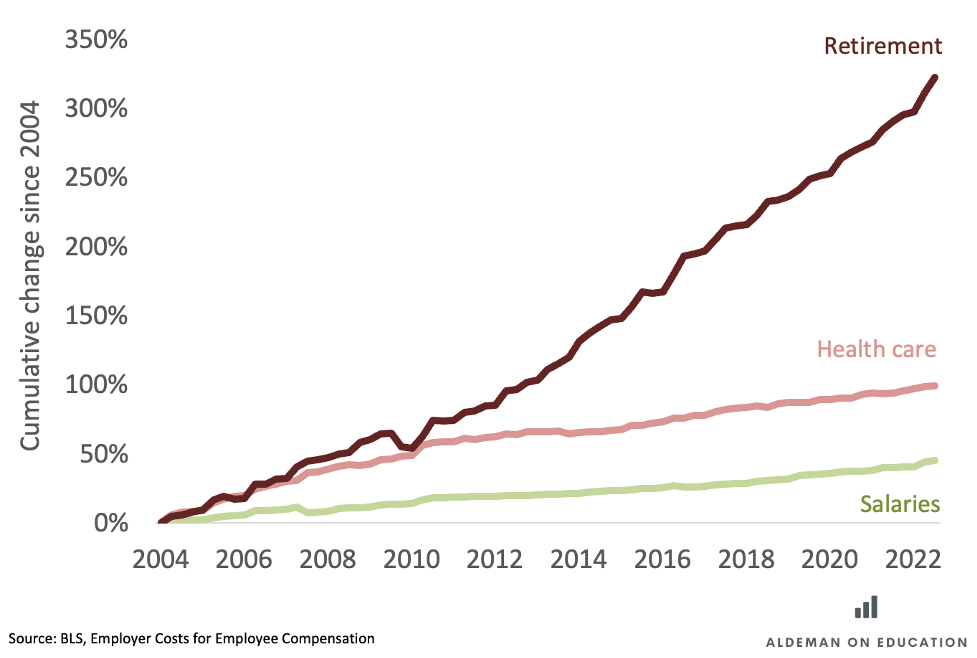
Teacher retirement costs are the big outlier. They rose 7.9% per year from 2004 to 2011, and they’ve continued to rise by 8% per year since then. Figure 2 shows the cumulative change in retirement costs since 2004. As in Figure 1, teacher salaries are represented by the light green line. Health care is in pink: It grew rapidly for a while but has since followed about the same growth rate as salaries. Retirement costs, in dark red, began diverging sharply from the other two around 2010. Overall, teacher salaries have grown by 44% since 2004, health insurance costs have risen 99%, and retirement costs are up by a whopping 322%.
Figure 2: Teacher Retirement Costs Are Rising Much Faster Than Health Care or Salaries
This might be less of a problem if the increase in retirement costs led to a similar increase in individual teachers’ expected retirement payouts. But that’s not what’s happening. Quite the opposite: Thanks to poorly funded pension plans, states have increased contribution rates while simultaneously cutting retirement benefits for workers.
The Growth in Pension Debt Costs
A pension is a promise to workers. In this case, state legislatures have promised teachers who qualify for benefits guaranteed monthly payments from the time they retire until they die. To make sure they have enough money to pay for those promises, states have to make assumptions to determine the future value of those pensions. They also need to estimate how much money to save today and how fast those investments will grow over time.
Pension plans break down their costs into two buckets. The first is what pension actuaries call the “normal cost,” or the estimated cost of the retirement benefits workers earn in a given year. If any of these estimates is wrong, the plans can accumulate unfunded liabilities — a form of debt that’s owed to the pension plan.
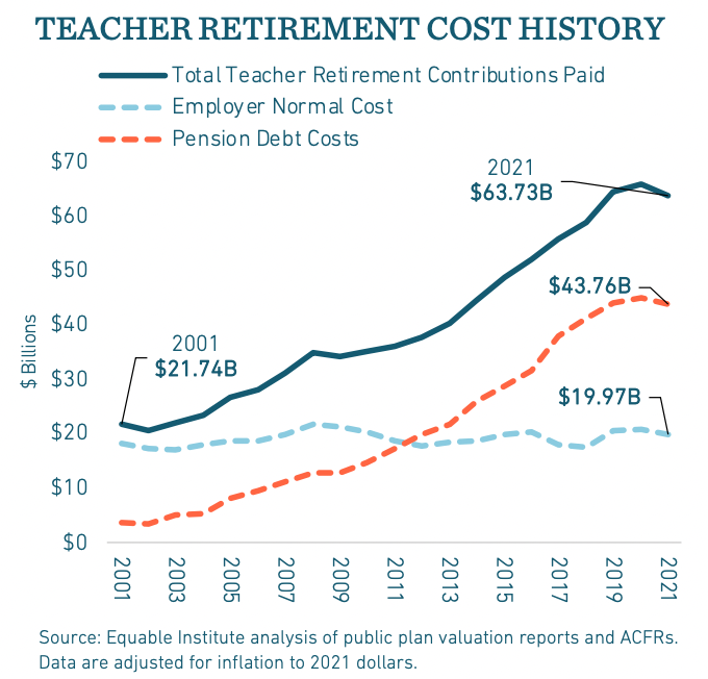
Figure 3 comes from a new report from the Equable Institute. It shows how teacher pension costs have changed over time. The light blue dotted line shows that the employer share of the normal costs — the value of the retirement benefits teachers receive — has gone down a bit over time, reflecting a slow phase-in of benefit cuts for new workers.
Meanwhile, the red dotted line in the graph shows pension debt costs — the amount of money states and school districts are paying to address the shortfalls accumulated in previous years. As the chart shows, all of the growth in pension costs over the past two decades has come from these debt payments.
Figure 3: States and School Districts Are Spending More on Retirement Benefits While Workers Receive Less
The Equable Institute report estimates that states and school districts are spending $44 billion a year on these pension debt costs. They leave it for us to imagine what schools might be able to do with that extra $44 billion. By my back-of-the-envelope math, that money could raise the average teacher salary by almost $14,000 per year. While the situation varies across states and school districts, at the national level, the solution to raising teacher salaries must start with addressing the growing teacher pension debt costs.
How to Solve the Pension Problem and Raise Teacher Salaries
As the Equable Institute report shows, states like Wyoming, South Dakota, Delaware, Nebraska, and Florida have all done a comparatively good job of managing the growth in pension costs. What lessons can other states borrow from them?
The biggest one, by far, is to set more reasonable investment return targets. States have an incentive to be overly aggressive with their pension assumptions so that on paper they don’t need to contribute as much along the way. But that only hides the real costs and forces plan managers to seek out riskier investments. Lowering the assumed rate of return would cause some short-term pain as budget makers faced up to the true costs, but over time it would help plans get back on sound financial footing.
State leaders should also stop passing the buck on to school districts. Right now, state leaders can say they’re increasing education budgets while they turn around and raise the pension contribution rates that all school districts are required to pay. This two-step allows states to shirk their pension responsibilities, and it’s not fair to school districts. After all, states have an easier time raising revenue than local districts, and they can do so in more progressive ways than local districts can. And since state leaders were responsible for creating the unfunded liabilities in the first place, they should be responsible for paying them off.
Treating pension debts as a long-term state obligation, just like any other state debt, would allow states to own up to the problem and come up with a responsible plan to address it over time. In turn, that would leave school district leaders to focus on raising teacher salaries and getting more money into their paychecks. But this all hinges on policymakers understanding and acknowledging their large and growing pension debt problem — and doing something about it.
In the next installment of this series, I’ll translate these pension costs into per-pupil and per-teacher numbers for the largest school districts in the country.
Taxonomy:If Mississippi leaders are looking for ways to improve teacher compensation, here’s one idea that wouldn’t cost them any money: Give K-12 teachers the same retirement plan options that faculty members at the University of Mississippi already have.
In Mississippi, both K-12 and higher education employees are automatically defaulted into the same defined benefit pension plan run by the Public Employees’ Retirement System (PERS). Members have to stay eight years to vest and qualify for a benefit upon reaching retirement age. Like other traditional pension plans, benefits are awarded through a formula tied to the member’s salary and years of service.
The standard PERS plan is quite costly to employers and taxpayers, but it’s not all that generous to members. According to the plan’s actuaries, who analyze the plan’s finances, the average member earns a benefit each year worth only 1.09% of their salary. (If that seems too low to be true, see page 11 of PERS’ latest actuarial valuation report.)
But wait, how can this be? Overall, PERS employers are contributing 17.4% of each member’s salary. Where is that money going? The difference is explained by the fact that PERS has promised benefits worth $18.7 billion more than it has saved. Like someone carrying a credit card balance, PERS has to pay down those debts, and that contribution eats 16.06% of each member’s salary.
In other words, the PERS pension plan is barely a benefit at all.
Mississippi’s K-12 employees are stuck with the traditional pension plan. But beginning in 1990, the state legislature directed PERS to create another plan. That plan, called the Optional Retirement Plan (ORP), is solely for employees at Ole Miss, Mississippi State, and other public colleges and universities across the state.
The ORP plan operates more like a 401k, where employers make contributions toward individual accounts. But unlike a typical 401k in the private sector, where employees are lucky to get a 4 or 5% match, all ORP plan members receive a 14.75% employer contribution directly into their retirement accounts.
Unlike K-12 teachers, Mississippi’s higher education faculty get to pick which of these two PERS plans best meets their needs. The traditional pension plan provides a guaranteed stream of revenue based on the benefit formula, whereas the ORP plan does not. But calculations from TeacherPensions.org suggest that guarantee is not worth that much: A PERS member would need to stay in the plan for 30 consecutive years before their pension would be worth more than their own contributions plus interest.
It’s possible that some very long-serving veterans might receive a better benefit under the PERS plan. But for most participants , the ORP plan is delivering a better deal. Moreover, ORP members qualify for benefits immediately, whereas the pension plan members have to teach for eight years or they won’t qualify for any benefit at all.
If K-12 and higher education employees are fundamentally different, then it might make sense to offer different retirement plans to each sector. But Mississippi already enrolls most of its education employees across both sectors into the traditional PERS pension plan; the only difference is that higher education employees have the option to leave.
And, even if instructional staff are different across the two sectors, both the K-12 and higher education retirement plans cover many more employees than just those in teaching roles. For example, both plans include secretaries, librarians, janitors, or bus drivers, whose jobs may not look all that different across the two sectors.
As we show in a recent report for TeacherPensions.org, Mississippi is not the only state that offers different retirement benefits for K-12 teachers and higher education employees. If given the choice in Mississippi, some K-12 workers might stick with the traditional PERS plan. But that’s the point. The “right” retirement plan may vary for each individual, and legislators may not be able to design one retirement plan that fits all life patterns.
The math suggests that the ORP plan would provide a better retirement benefit for the vast majority of Mississippi’s education employees. Even if the financial arguments aren’t enough to convince everyone of the merits of the ORP versus the traditional pension plan, K-12 teachers at least deserve to have the same choices as higher education employees already have.
Chad Aldeman is the Policy Director of the Edunomics Lab at Georgetown University.
Yesterday, the Thomas B. Fordham Institute released my new paper on the retirement plan options offered to Ohio teachers. Since 2001, the Buckeye State has given new teachers a choice over three different retirement plans--a traditional defined benefit pension plan, a 401k-style defined contribution plan, and a combined plan that includes elements of both. If a teacher makes no affirmative choice within 180 days of employment, Ohio automatically puts them into the traditional pension plan.
In the paper, I walk through the reasons why Ohio should change its "default" setting from the pension plan to one of the other options. But why does it matter? Won't teachers make the best decision for their own lives regardless of what the default setting is?
As I write in the paper, there's abundant evidence that workers listen to and respond to defaults. Whether that's simply because of inertia or because workers view the default choice as a form of profession advice, defaults do affect people's behavior:
Research from the private sector has found that employee defaults like the one employed by Ohio STRS can be powerful mechanisms. Workers, especially new ones, have a lot to figure out, and when given an option to join an employer-provided retirement plan, many new employees fail to make decisions. When employers switch the default option to assume automatic participation, enrollment rates jump 25 to 35 percent. Similar research has found that employees are likely to follow default options on contribution rates and investment decisions. None of these choices are mandatory, but this body of research suggests there are ways to “nudge” workers into making smart decisions.
Although it didn't make it into the paper, I wanted to show you an example of the power of defaults and nudges in the public sector.
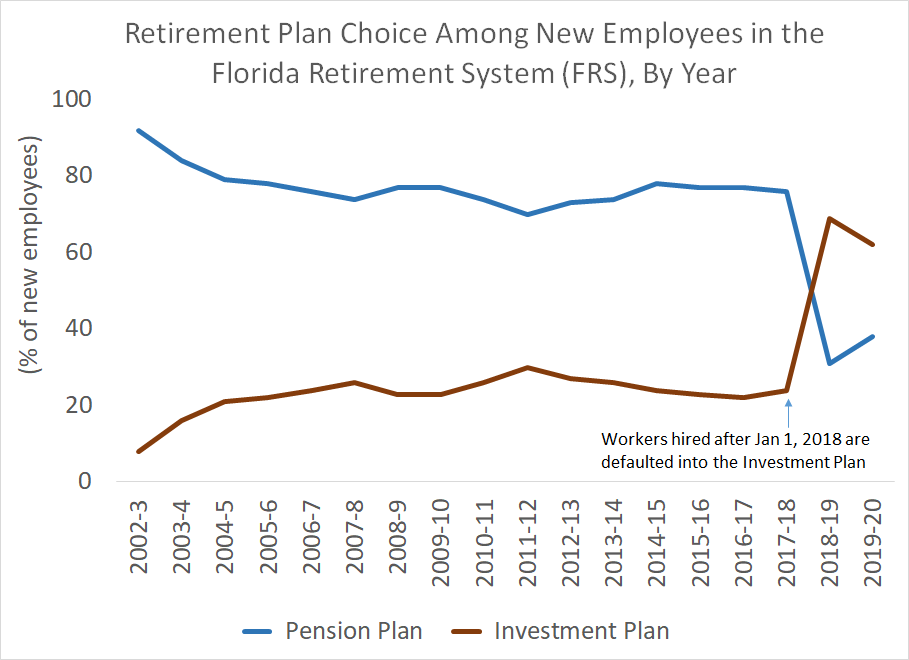
It comes from Florida, which is on a similar path as Ohio. Starting in 2002, Florida began offering its public employees a choice over two plans run by the Florida Retirement System (FRS). FRS includes teachers and other education employees, but it also includes other types of public-sector employees. Starting with new hires as of January 1, 2018, Florida switched the default option from its Pension Plan to its Investment Plan.
The graph below shows what happened next. Before the switch, about one-quarter of new employees were selecting the Investment Plan, and about three-quarters were selecting the Pension Plan. Immediately after the state changed the default option, those numbers reverse. In the two years since the change, about two-thirds of workers are enrolling in the Investment Plan, and only about one-third are selecting the Pension Plan.
Another way to look at this is to look at the percentage of employees who actively choose a plan, versus those who merely default into one of the options. In Florida, those numbers have held relatively steady over time: About half of all new employees make an active decision into one of the two options, while the other half simply defaults into whatever plan the state recommends. (See here for the raw numbers.)
Florida made its decision based on the evidence in their state. As FRS was trying to educate employees about their choices, they published a graph showing that all workers hired under the age of 45 would be better off in the Investment Plan. Even for those workers hired over the age of 45, FRS estimated they would need to remain in the system for more than eight years before the Pension Plan would be a better deal. That sort of evidence was enough to convince Florida legislators to make the shift.
My paper shows that Ohio legislators have similarly compelling evidence about what plans are best for its teachers. Every year that passes is another year where the state has to cut benefits and raise contribution rates into its Pension Plan. Meanwhile, school districts are contributing 14 percent of teacher salary into the Pension Plan, but none of that money is going toward worker benefits; it's all going to pay down the pension plan's unfunded liabilities. As my analysis made clear, Ohio teachers would be better off in either the Combined or the DC Plan, regardless of how long they serve.
It's important to note here that we're not talking about taking any choices away from people. In both Florida and Ohio, workers already have a choice over their retirement plan. The question is merely what plan the state(s) should recommend for workers who make no decision. Changing the default option would not affect current teachers or retirees. And they would not take away choices for new employees. But Ohio could make a simple change to put more of its educators on a default path to a secure retirement.