It can be hard to get a handle on teacher retirement costs. Collectively, states and school districts spend about $63 billion a year on employee retirement benefits, but what does that mean for individual school district budgets? How do these figures translate into per-pupil or per-teacher terms?
On average, I estimate the largest 100 school districts in the country are spending $1,549 per student on teacher and other employee retirement costs. However, as an earlier post in this series showed, this number is largely driven by “pension debt” costs — the promises that states made in the past but never properly saved for. Large school districts are devoting only about one-third of their retirement costs to benefits for today’s employees, with the rest going toward pension debt costs.
Are these numbers big or small? They vary widely across the country. But to put the national totals into perspective, the amount schools are spending on pension debt is roughly on par with the per-pupil cost of providing small-group tutoring services.
The analysis below explains how pension costs translate into per-employee and per-student estimates at the district level. The Methodology section at the end describes how I came up with the estimates and why we don’t have better answers to these questions in the first place. The Appendix has the detailed results for each of the 100 largest school districts.
Pension Costs for Individual Employees
The starting point to understand school district pension costs is to look at contribution rates.
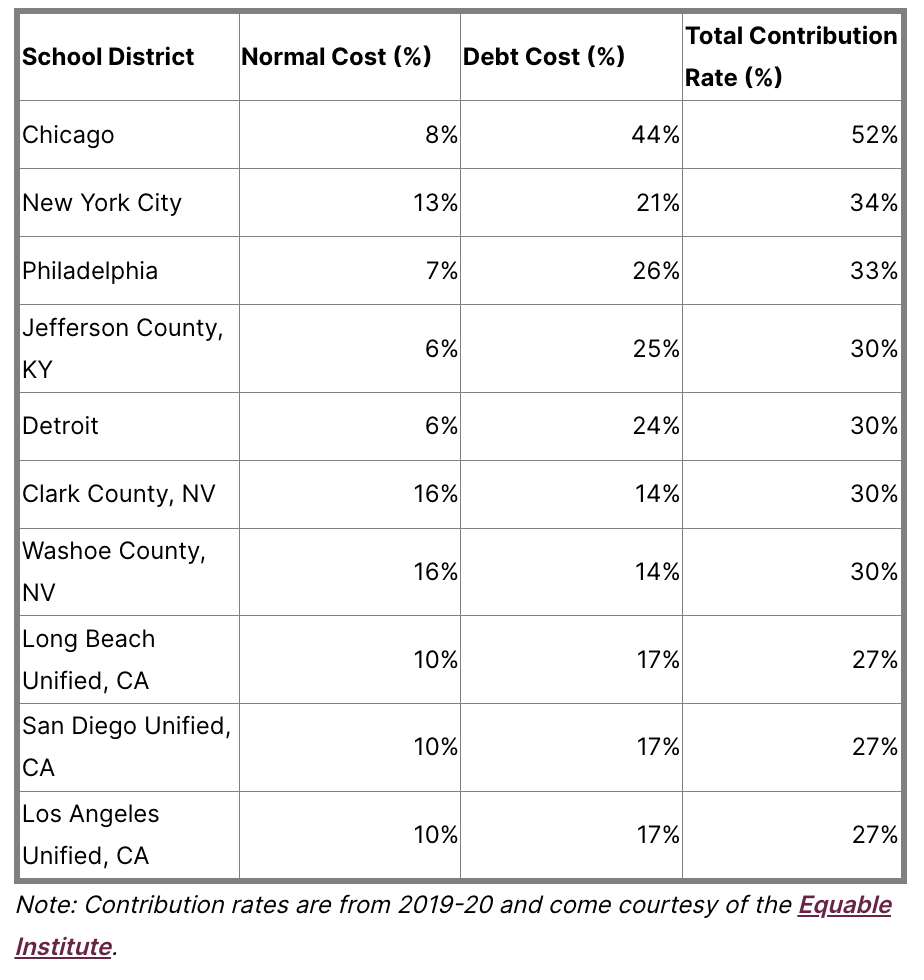
A contribution rate is expressed as a function of salary. For every $1,000 a district pays in salary, how much will it have to contribute to the pension plan? Table 1 shows the 10 districts in the sample with the highest required contribution rates.
At the top of the list is Chicago, with a required contribution rate of 52%. For every $1,000 Chicago agrees to pay in salaries, it also needs to budget $520 in retirement contributions.
Table 1: Top 10 School Districts With the Highest Teacher Pension Contribution Rates (%)
Chicago teachers won’t ever get that money directly as compensation; it goes to the pension fund. But how does this money translate into benefits for retirees?
Pension plans break down their costs into two buckets: what pension actuaries call the “normal cost” or the estimated cost of the retirement benefits active workers earn that year, plus any unfunded liabilities.
Chicago is budgeting for an 8% contribution toward the normal cost of benefits. It’s comparable to what a private-sector employer might contribute to a 401(k) plan, but it differs in several respects. Pension benefits are derived from a formula that rewards longevity. The longest-serving veteran teachers in Chicago can expect retirement benefits worth more than that 8%, but most workers will get less.
On top of that, Chicago school district employees are part of the 40% of teachers nationwide who do not participate in Social Security. Whereas employers in the private sector make 401(k) contributions on top of the 6.2% Social Security tax, Chicago doesn’t have to make that contribution, and employees don’t get credit toward their Social Security benefits.
Defined benefit pension plans like the one in Chicago can also build up unfunded liabilities, or pension debt, if any of its estimates are wrong, if investments are less than expected, or if contributions in the past were insufficient.
Chicago has accumulated a lot of pension debt. As a result, it now must pay a whopping 44% of each employee’s salary each year just to pay down those unfunded liabilities.
Chicago is an extreme outlier, but the majority of large districts are paying more in pension debt costs than they are in normal costs. Only six big-city districts — Milwaukee; Washington, D.C.; Mesa Unified in Arizona; Clark and Washoe counties in Nevada; and Seattle — are paying more for benefits than they are for pension debts (Appendix, Table 1).
How do these contribution rates translate into pension costs per employee? Table 2 shows the districts in the sample with the highest total retirement costs per employee.
At $55,376, Chicago again leads the country, and it’s not particularly close. It “wins” the prize thanks to both a high average salary per employee (more than $106,000 a year) and a high contribution rate (as discussed above) on those salaries.
Table 2: Top 10 Districts With the Highest Annual Pension Costs Per Employee (in U.S. Dollars)
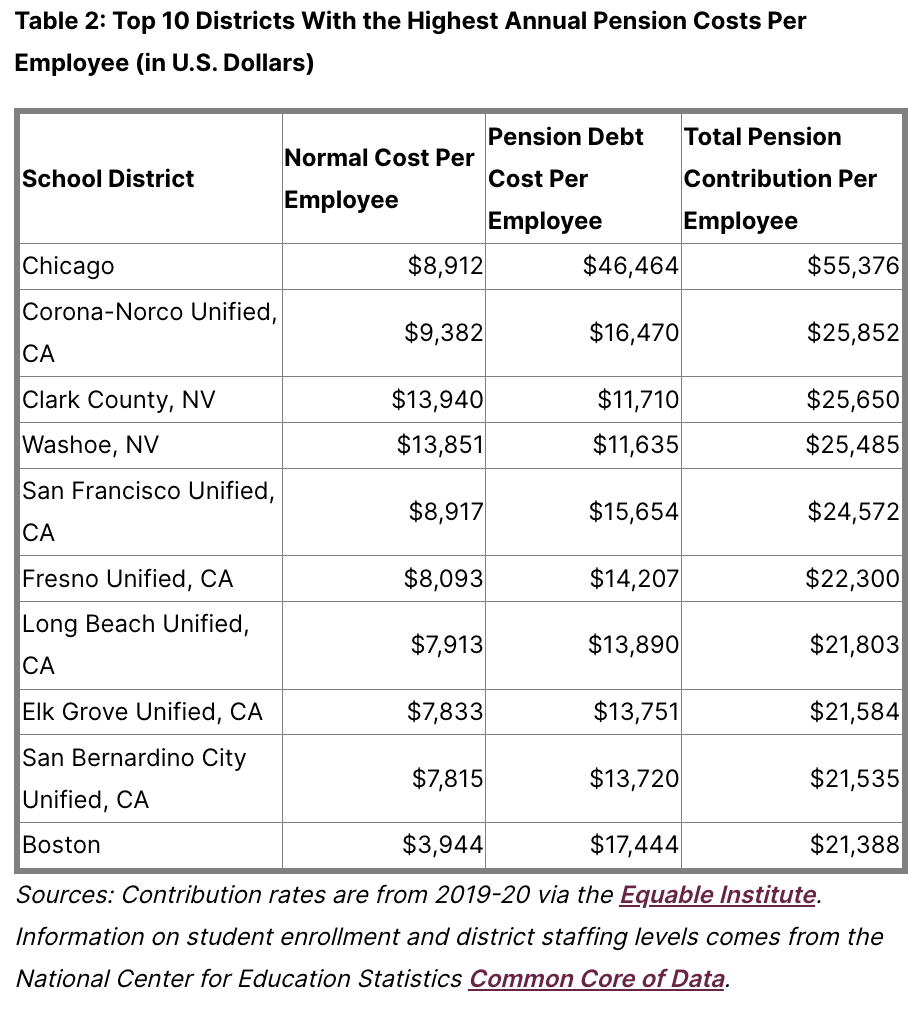
The next-highest district on the list is Corona-Norco Unified in California. It is paying the equivalent of $25,852 on behalf of each employee toward the state pension plan. Only about one-third of that is going to benefits for active employees, though; the remaining $16,470 is going to pay down the state’s unfunded pension liabilities.
Notably, none of the districts on this list participates in Social Security. Compared to states that offer employees both a pension plan and Social Security, the pension plans in non-Social Security states tend to cost more and be in worse financial shape.
On average, the 100 largest school districts are paying the equivalent of $8,670 per year in pension debt for every employee. That money is being spent on behalf of teachers and other employees, but it won’t ever go into their pockets. It represents billions of dollars that might have been available to raise teacher salaries in these districts if state legislators and governors had responsibly funded their pension promises in the past.
Pension Costs Per Pupil
There’s a growing body of research showing that spending more money on education boosts academic outcomes and long-term career trajectories for students, especially low-income students. That makes sense if higher spending is translating into more instructional aides, higher teacher salaries, or better facilities. But is more money for education helpful to students if it’s invested in paying down pension debts? Likely not.
That’s why it’s important to also look at pension costs in per-pupil terms. The 100 largest districts are spending an average of $1,549 per student per year on pensions. Those range from a low of $420 per student in Shelby County, Tennessee, to a high of $4,641 in New York City (Table 3).
Table 3: Top 10 Districts With the Highest Per-Pupil Pension Costs
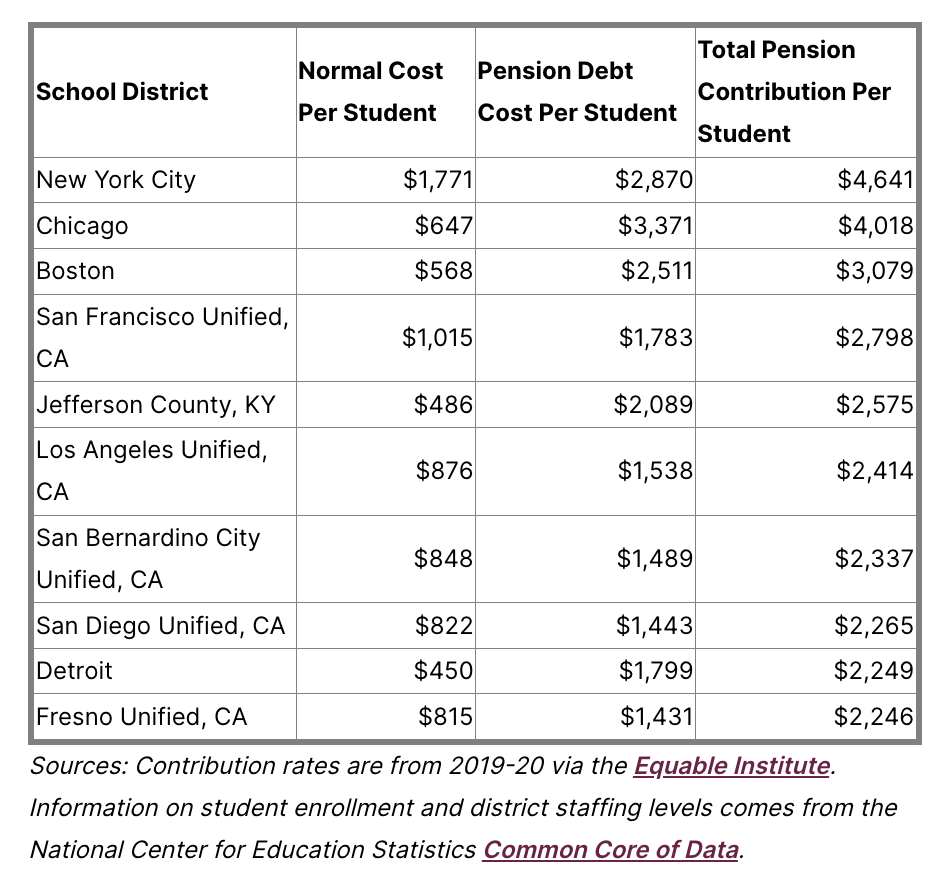
Again, most of the investment is not going toward compensation for educators supporting today’s students: About two-thirds ($1,002 per student) is going toward pension debt costs. That amount is roughly on par with estimates of the per-pupil cost of creating a dedicated corps of tutors to support students.
In the absence of pension debts, it’s hard to definitively prove whether districts would spend their money on tutoring or raising teacher salaries or any other specific activity. But research suggests that higher pension costs translate into fewer teachers and can crowd out spending on things like school facilities and textbooks.
States Have a Responsibility to Act
District leaders are often responsible for paying the pension bill and are the ones who feel the tightening in their discretionary budgets as a result. But, ultimately, pension problems are state problems. State legislators set the rules for teacher retirement benefits, and they decide — directly or indirectly — how much to contribute to the plan each year. Their choices create debt obligations that filter down to districts.
State leaders may want to engage their labor groups on this pension squeeze, and on whether workers would prefer compensation in the form of salaries or benefit promises. In a vacuum, employees will say they want higher salaries and better benefits — until they understand the financial trade-offs and options available to them.
Individual teachers may also have different preferences. Rather than offering only one retirement plan for all 8 million public education employees, more states could offer K-12 employees a choice over their retirement plan. For example, many states offer retirement benefits for higher education employees that are both more generous and more flexible than what’s offered to K-12 workers. Offering different types of retirement plans could help states constrain costs while making individual employees happier.
But the first step is to understand and acknowledge the problem. Accumulated pension debts cannot be ignored or wiped away. Millions of active and retired workers are depending on their promised benefits. State leaders could start by treating teacher pension debts just like all other long-term state obligations and coming up with a responsible plan to pay them down over time.
Check out the Appendix to find the pension cost burden for individual cities.
Appendix: Methodology, Terms, and Sources
Access Appendix Table 1: School District Retirement Costs (2019-20)
I set out to estimate how much school districts spend on teacher and other employee pension costs. There are other attempts to answer similar questions, but those are national rather than local, don’t break out information by the normal cost of benefits versus the cost of unfunded liabilities, or lump pension spending in with other benefits. The methodology I came up with here is certainly not perfect, and there are some sources of error that I’ll discuss. Anyone looking for a precise number for a given district should consult with the district finance office. As such, the numbers here should be treated as plausible estimates rather than precise budget amounts.
For the purposes of this piece, I’m using what are known as actuarially required contribution rates. In some places, an employer might pay less than what’s actuarially required, but the actuarial rate is the amount the plan believes it needs to stay solvent.
I’m attributing all “employer” contribution rates to a given school district, but in some places, the state pays some or all of the “employer” contribution rate. In those cases, I’m attributing spending to a district that comes from the state, so the estimates here should be interpreted more as “spending attributable to a district” rather than “spending that directly comes out of a district’s budget.”
The data on contribution rates are from 2019-20 via the Equable Institute. At times I use the word “pension,” but the data also include contributions toward defined contribution or other state-provided plans. Other than a few citywide plans, such as those in New York City; Kansas City, Missouri; and St. Louis, Missouri, I applied the statewide “teacher” plan contribution rate across all of a school district’s employees. That miscounts some employees who may be covered by a different plan, but plan participation data is not available at that level of detail.
Information on student enrollment and district staffing levels come from the National Center for Education Statistics Common Core of Data. Because the 2019-20 staffing counts were missing for some districts, I used a multiyear rolling average of all staff. I use the term “teacher” throughout the piece, but the data include and are applicable to all school district employees, including but certainly not limited to classroom teachers.
Taxonomy: