Teacher pension plans are extremely back-loaded. They offer short- and medium-term workers--the majority of all teachers--very little in the way of retirement benefits.
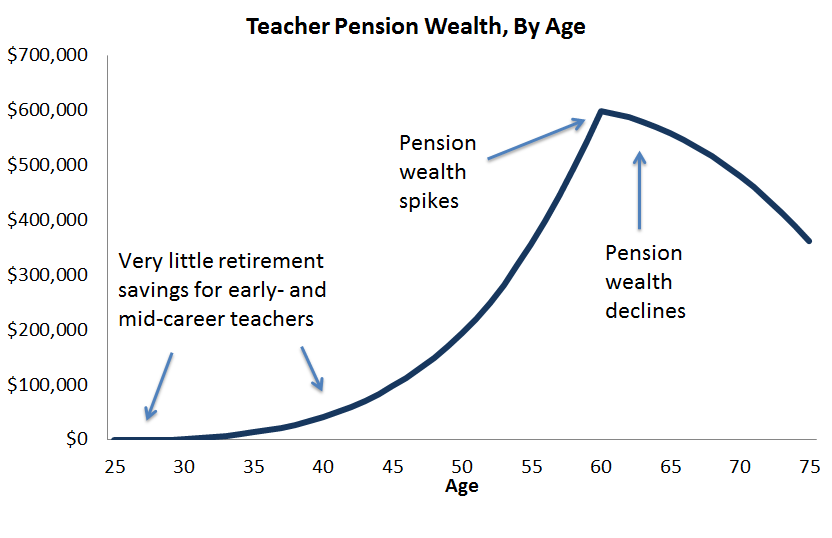
The graph below shows an example of how retirement benefits accumulate under a traditional pension plan. For a teacher who begins her career at age 25, she won't have much in the way of retirement savings for the first 10 or 20 years of her career. Then, if she's still teaching, her pension benefits will escalate quickly as she nears the state's normal retirement age (in this example, it's 60.) After age 60, her pension benefits will actually start to decline, because every year she continues teaching is a year she won't be drawing her pension. The pension plan will give a strong financial "push" for teachers to leave teaching.
This arrangement is bad for all teachers because it leaves them without sufficient retirement savings for long stretches of time. Half of all teachers won't qualify for a pension at all, and another group of mid-career teachers will qualify for only a meager pension. Only a small fraction will reach the back-end and truly maximize their pension.
But this arrangement is particularly bad for groups of teachers with high turnover rates. That includes urban and rural teachers, teachers in certain subject areas, and teachers in charter schools.
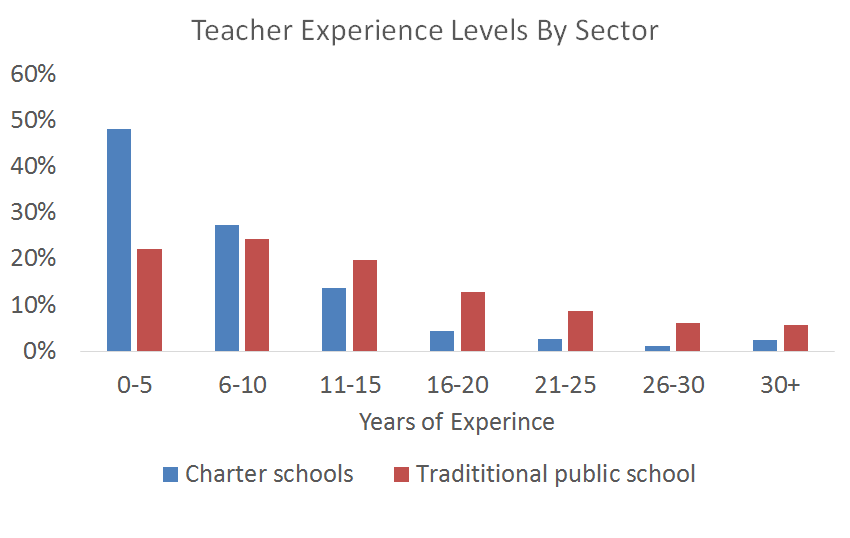
Charter school teachers are some of the biggest losers under current pension plans, because very few charter school teachers have worked long enough to qualify for the back-end benefits offered by traditional pension plans. The chart below compares experience levels in charter schools versus traditional public schools. The data come from the 2011-12 Schools and Staffing Survey, and they show the charter sector as a whole has teachers with significantly less experience. About half of all charter teachers had five years of experience or less, and two-thirds of charter school teachers had 10 years or less. In contrast, traditional public schools had three times more teachers with 20 or more years of experience, and almost four times as many teachers with 25 or more. In other words, few charter school teachers have accumulated the experience necessary to claim the real rewards from state pension systems.
Charter schools are still relatively new, so some of these disparities may be due to the fact that charter school teachers haven't had enough time yet to age into the profession. But charters also have higher annual turnover rates, suggesting that fewer of their teachers will ever truly benefit from existing pension systems. And, in the meantime, charters are on the hook for paying off large legacy costs of accumulated pensions debts. These legacy costs are so high today that new teachers will never accumulate benefits worth more those contributions. This is true for all teachers, not just charters, but charters participating in pension plans will have to contribute the same amount as all other schools, even if their teachers aren't benefitting and they weren't responsible for the accumulated debt.
In other words, pension plans should thank charter schools for subsidizing their past debt. Meanwhile, charter schools should think about how to provide retirement benefits that more closely match their workforce.
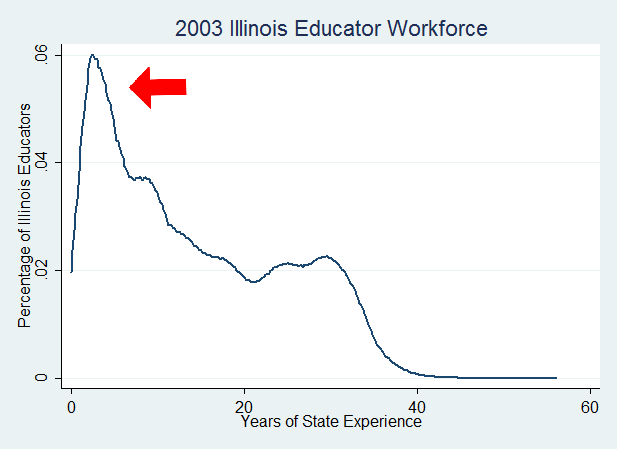
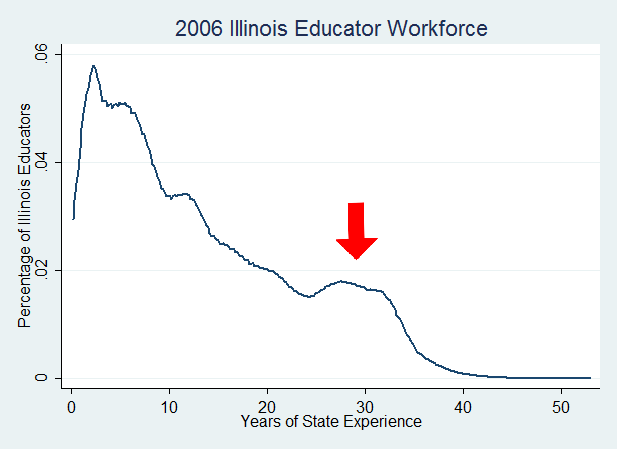
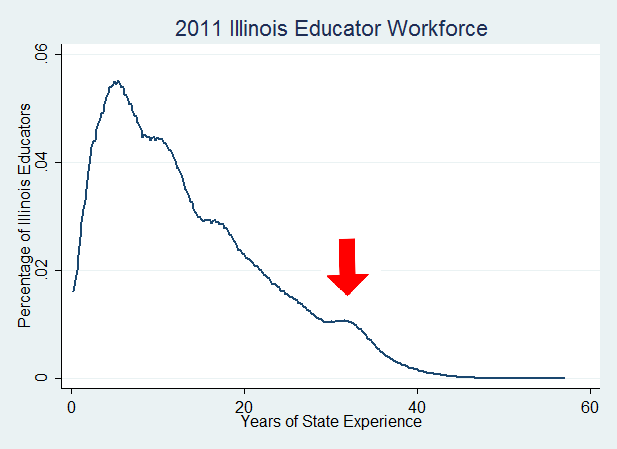
How has the Illinois educator workforce changed over time? Illinois' average years of experience has held roughly constant at 13 for the past decade. But while the average stayed about the same, there were significant changes going on underneath. The images below show how the shape of Illinois’ educator workforce experience has fluctuated over time (skip to the bottom of this post to see the full gif).
The following data comes from a longitudinal dataset that Chad Aldeman, Melissa King, and I compiled from the Illinois Teacher Service Records (now known as the Employment Information System). Since 2001, the Illinois State Board of Education has been publishing annual information describing characteristics of all teachers, principals, and other school support staff employed in Illinois public schools. The majority (85 percent) of the sample are teachers.
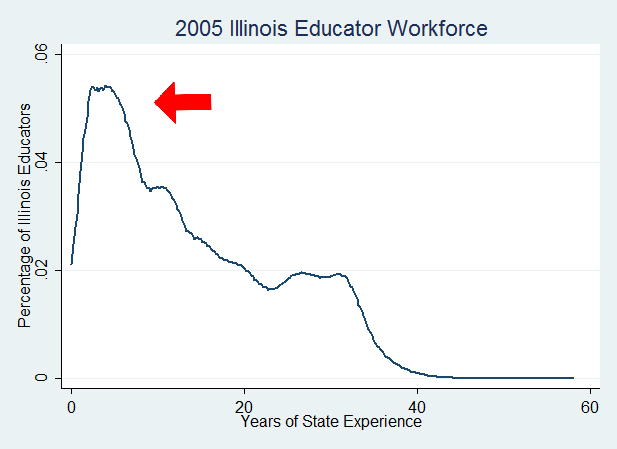
On the front end, Illinois' new hires fluctuate based on district hiring practices. You can see this in the first peak in each of the graphs below, for the years 2003 and 2005.
When districts hire more people, the graph picks it up as a noticeable peak at the front end. When hiring falls, the peak gets shorter and spreads further to the right. This is the natural effect of slower hiring rates, and shows how employees start to age into the workforce and gain more experience.
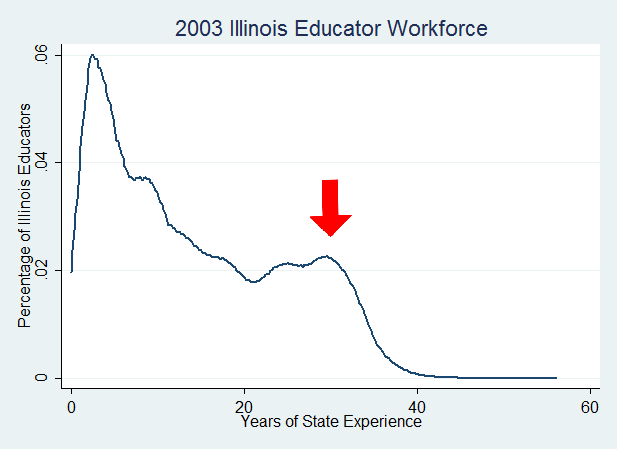
There's a second distinct peak in the graphs, a group of educators with 20-30 years of experience. This bulge likely represents Illinois educators from the Baby Boom generation.
Notice how the second peak bulges and shifts right as these teachers remain in the workforce and approach what will likely be full-career pension benefits.
By the end of this time period, this second bulge begins to shrink as these Baby Boom teachers begin to retire and leave the workforce.
Here is the full gif of Illinois’ workforce from 2002 to 2012. Again, remember that the "average" years of experience stays nearly constant through all these years, but the overall pattern shifted. Watch how the state's school districts changed their hiring patterns through the years, and how a large group of Baby Boomers slowly began to age out of the workforce.
According to an L.A. Times story earlier this week, a Los Angeles charter school is trying to avoid retiree healthcare costs by paying its veteran teachers to leave the school and return to the Los Angeles Unified School District (LAUSD). El Camino Real Charter High School is offering its veteran teachers up to $30,000 if they retire with the district rather than the charter school.
There’s clearly something unsettling about the incentives here, and the story spurs several questions around benefit accessibility, cost, and responsibility:
- How well is the current retiree healthcare structure actually benefitting employers and employees? El Camino Real is acting in its own financial interests by offering buyouts, but it also suggests that the financial incentives have become so bad that they’re willing to pay their most experienced teachers to leave. LAUSD may attract these veteran employees, but then will need to foot the bill for retiree healthcare benefits (and pension contributions). In the article, LAUSD officials spoke about creating rules against this sort of practice. Would that restrict their ability to hire veterans? Should districts make decisions about who to hire based on retiree healthcare obligations?
- Why was an individual charter promising retiree healthcare at all? Unlike regular healthcare costs, which are somewhat more predictable—they may rise in a given year, but are still a function of the current workforce—health benefits for retirees are a long-term obligation. In that sense, they’re uncertain, because costs may balloon rapidly if retirees live longer or incur unprojected expenses. Retiree health insurance in California is currently collectively bargained at the local district level, and El Camino is just now realizing that they bargained for more than they could afford. Providing its own benefits package could distinguish the charter school, but in this instance it seems to have become more of a burden than a gain.
- Who should be responsible for funding retiree healthcare? LAUSD is a larger school district and can presumably better cover the uncertain costs than an individual charter school. The state may be even arguably better equipped to fund benefits. CalSTRS, the state pension system, has decided not to wade into retiree health insurance, and says it may consider financing retiree health benefits if the funding becomes available (but this seems unlikely). Having a state provider could centralize retiree health benefits and prevent smaller school districts or charters from having to fund benefits on their own.
- But it could also make things more complicated. While not on the same scale, retiree healthcare faces similar underfunding issues as pension benefits. And the state is already saddled with massive unpaid pension debt, now totaling $74 billion.
- The other elephant in the room is to what extent retiree healthcare coverage should be a part of a teacher’s compensation package. For better or worse, most employers don’t offer any form of retiree health benefits; workers need to independently figure how to afford health care in retirement, usually through a combination of private insurance and Medicare.
This story seems to spur more questions than answers, but it’s a signal of a strange set of incentives that California has created for its teachers and schools.
Taxonomy:Consider two hypothetical teachers with nearly identical resumes:
Ms. Early is 65 years old, and she taught for 20 years in our public schools. She began her career at age 25, but by 45 decided it was time to try something else. At the time she left teaching, her salary was $33,086, the equivalent of $50,000 today. She's now ready to retire and, because she taught for 20 years, she's eligible for a pension that will be paid out in monthly installments for the rest of her life. Her pension formula will be based on her years of experience (20) times a multiplier factor (2 percent) times her annual salary of $33,086. Her pension will be worth $13,234 a year.
Like Ms. Early, Ms. Late is also 65 years old, and she also taught for 20 years in our public schools. But Ms. Late tried various other careers before trying her hand at teaching at age 45. Her salary this year, her last year of teaching, was $50,000. She's now ready to retire and, because she taught for 20 years, she's eligible for a pension that will be paid out in monthly installments for the rest of her life. Her pension formula will be based on her years of experience (20) times a multiplier factor (2 percent) times her annual salary of $50,000. Her pension today will be worth $20,000 per year.
These two teachers are identical in all ways except for one critical difference: the age at which they began teaching. And yet, that difference will mean Ms. Late will qualify for a pension that's 50 percent larger than Ms. Early's. Over a full retirement--65-year-old women today are projected to live another 21.5 years, on average--Ms. Late will qualify for retirement benefits worth almost $140,000 more (in today's dollars) than Ms. Early.
The explanation here is pretty straightforward. In every state, a teacher's pension amount is based on her final salary in the last year she worked, regardless of when that happened to be. (Social Security, in contrast, automatically adjusts prior years' earnings.) This is a key reason why teacher pension plans are so back-loaded, and it means that pensions reward later-career service much more heavily than early-career service.
This situation becomes even more pronounced when looking at teachers with shorter careers. Instead of two hypothetical teachers, each working 20 years, imagine four teachers who each teach for 10 years. One teaches from age 25-35, a second from 35-45, a third from 45-55, and a fourth from age 55-65. All four teach the same number of years and earn equivalent salaries (in present dollars). But because of this timing issue, the fourth teacher would qualify for a pension worth more than twice what the first teacher would earn.
All of this creates some strange risks and rewards. Teachers who start at younger ages have the potential to earn much larger pensions by the time they retire, but, because they have more years to go, they're also much less likely to make it that long. Younger teachers also face different calculations about what to do with their pension. For a 35-year-old leaving the profession, it may make sense to cash out a pension and roll it over into some interest-bearing savings. Otherwise, the money will just sit there and not earn interest. For someone closer to retirement, the pension may be a better deal. Teachers must know how pensions work in order to maximize their retirement saving in their unique situations.
From a public policy standpoint, it doesn't make a whole lot of sense to prioritize one year of teaching over another. But that's exactly what teacher pensions do.
Want to learn more? Take three minutes out of your day to watch the explainer video below:
Interested in data on the average teacher pension in your state? See the chart below for data on the average teacher pension in your state. But before you do, here are some caveats to what you're looking at:
1. Not all teachers qualify for a pension. States can and do set relatively high minimum service requirements, ranging from five to 10 years, and over half of incoming teachers won’t qualify for retirement benefits in their state. Leaving these teachers out of the overall pool obscures who gets counted in the “average pension.”
2. Of the teachers who do qualify for a pension, their benefits will vary widely. The statistical average, or mean, hides the fact that only a small percentage of incoming teachers will receive a full career pension at retirement, while many, many more get only a small amount. Also, teachers in 15 states aren't covered by Social Security; pensions in these states tend to be larger to make up for this fact.
3. These amounts only tell us what a teacher earns at retirement—not what she contributed to her state or local system. The averages include many teachers who qualify for some pension, but those pensions may be worth less than the value of the teacher's own contributions.
Now onto the data. The first column shows the “average pension” for newly retired teachers from the past ten years in each state. The next column shows, amongst all newly retired teachers, what the median retiree earns. The last column show the estimated percentage of new teachers who will actually receive a pension. The data come from each state's annual comprehensive financial report.
In Maryland, for example, the “average pension” for new teachers is $35,000. But the median pension for new retirees is just $20,544, meaning half of all new retirees earn less than that amount. Moreover, 57 percent of new Maryland teachers are expected to leave the system before qualifying for any benefits at retirement. They're not included in the pension data at all.
Knowing what your state’s “average pension” can be interesting. But this amount doesn’t necessarily reflect the amount that many teachers actually earn. With those caveats in mind, here are the data:
Average Teacher Pension by State State
Average Benefit for New Retirees
Median Benefit for New Retirees
Percentage of New Teachers Who QUALIFY FOR a Pension
Alabama
$ 20,721.89
$ 19,728.00
39
Alaska (DB plan)
$33,845
$39,372
37
Arizona
$ 20,508.00
$ 20,328.00
100
Arkansas
$ 21,067.00
$ 17,784.00
57
California
$ 43,308.00
$ 40,008.00
69
Colorado
$ 37,452.00
$ 29,376.00
36
Connecticut
$47,386
55
Delaware
$ 20,485.00
$ 25,440.00
36
Distrct of Columbia
$ 63,468.00
$ 48,420.00
29
Florida
$ 19,765.00
$ 18,198.00
28
Georgia
$ 34,946.00
$ 22,835.16
33
Hawaii
$ 14,964.00
$ 30,252.00
25
Idaho
$ 17,043.00
$ 13,992.00
70
Illinois
$ 46,513
$ 52,188.00
50
Indiana (Pre1996 Fund)
$ 17,436.00
$ 21,516.00
Indiana (1996 Fund)
$ 16,392.00
$ 12,492.00
31
Iowa
$ 19,704.00
$ 15,180.00
42
Kansas*
$ 12,929.00
$15,924.12
44
Kentucky
$ 34,685.00
$ 36,330.00
67
Lousiana
$ 23,828.00
$ 25,836.00
56
Maine*
$ 20,333.00
$ 24,312.00
14
Maryland
$ 34,956.00
$ 20,544.00
43
Massachusetts
$ 38,637.00
12
Michigan
$ 21,348.00
$ 4,680.00
43
Minnesota (All retirees)
$ 20,283.00
50
Mississippi*
$ 18,764.25
$ 17,064.00
24
Missouri
$ 41,344.52
$ 47,460.00
58
Montana
$ 21,153.00
$ 27,708.00
35
Nebraska
$ 22,590.15
$ 20,288.39
32
Nevada
$ 30,468.00
$ 27,036.00
57
New Hampshire
$ 21,355.00
$ 7,020.00
31
New Jersey
$ 40,104.00
56
New Mexico
$ 21,165.96
$ 19,765.68
33
New York
$ 44,383.40
$ 46,920.00
40
North Carolina
$ 18,443.00
35
North Dakota
$ 31,596.00
$ 57,413.00
56
Ohio
$ 46,620.00
$ 57,696.00
34
Oklahoma
$ 19,846.00
44
Oregon
$ 28,320.00
$ 28,296.00
46
Pennsylvania
$ 24,603.00
$ 23,664.00
36
Rhode Island
$ 44,953.00
51
South Carolina
$ 19,630.00
$ 26,287.80
37
South Dakota
$ 18,717.00
$ 18,120.00
53
Tennessee
$ 18,612.00
$ 10,668.00
56
Texas
$ 44,556.00
59
Utah (noncontributory)*
$ 21,063.00
$ 19,512.00
Utah (contributory)*
$ 15,996.00
$ 25,020.00
52
Vermont
$ 18,230.18
$ 27,245.00
33
Virginia
$ 21,962.50
$ 18,708.48
50
Washington (PERS 1)
$ 28,203.65
$ 26,529.84
Washington (PERS 2)
$ 20,775.48
$ 18,311.28
55
West Virginia
$ 19,165.69
$ 23,364.00
39
Wisconsin*
$ 22,911.00
$ 13,392.00
64
Wyoming
$ 17,556.00
42
Source: Data collected from state comprehensive annual financial reports. Teacher state plans were used unless otherwise noted.
**Out of all retirees.
*Average for all participants plan; includes teachers and other state employees.
Last updated 4/13/16. For more updated data, see here.
Taxonomy:Many people are surprised to hear that not all workers are covered by Social Security. But for the 1.2 million public school teachers who remain without coverage, this remains a daily reality. Teachers in California, Texas, Illinois, Massachusetts, and Connecticut, to name just a few of the non-participating states, neither pay into nor receive Social Security.
To deal with this spotted landscape, Congress created two somewhat obscure policies that affect workers and families who split their time in and out of Social Security. These teachers face two provisions on any Social Security benefits they may have earned outside of the classroom: the Windfall Elimination Provision (WEP) and the Government Pension Offset (GPO).
Both provisions were passed to align with Social Security’s design. Social Security is based on a progressive benefit formula, meaning lower-income workers receive a greater proportion of benefits relative to their income than higher-income workers do. Social Security collects taxes from employee each year based on their earnings, and then at retirement age, the worker’s Social Security benefit is based on those contributions. But teachers who don’t participate in Social Security don’t contribute either. When they retire, they will appear to Social Security to have a lower income, and in turn, qualify for a larger, progressive benefit.
To give a real-world example, consider a California science teacher who worked half her career as an engineer and half as a teacher. As an engineer, she and her employer both paid into Social Security, but during her years as a public school teacher in California, neither she nor her district employer paid into Social Security. When she retires, she’ll have contributions for her time as an engineer and a series of zeros for her years in the classroom. She’ll therefore appear to have an income much lower than what she actually earned.
Without WEP, the Social Security formula would try to make up for low income and provide her a proportionally more generous benefit. Under WEP, however, her individual benefits are reduced so they eliminate this initial advantage. As a result, the teacher may face a maximum reduction equal to half of her pension (up to $413 monthly or almost $5,000 annually). If she’s married and has a spouse who paid into Social Security, her spousal benefits (if she chooses to collect) are reduced by an amount equal to two-thirds her teacher pension under GPO. The WEP and GPO provisions are meant to even out any advantage a pensioned worker may receive from non-coverage.
This may work out for a teacher with an ample pension, but for the majority of teachers who will more likely end up of with partial pension, further truncating Social Security benefits will only make their retirement more precarious. Unfortunately, many teachers do not realize that their benefits will be reduced at retirement and do not plan accordingly. Placing all teachers in Social Security, while also providing teachers with adequate state-sponsored retirement plans, would enable more teachers to be prepared for retirement.
To learn more about teachers and Social Security coverage, see our Resources page here.
Taxonomy: