State-based teacher pension plans are important. They make up an enormous portion of local K-12 budgets, and the vast majority of them are underfunded. But despite their weight, or maybe as a symptom of, the intricacies of these systems can be difficult to navigate. The National Council on Teacher Quality’s recent report, Lifting the Pension Fog, works to demystify the topic. The NCTQ team, in partnership with EdCounsel, collected teacher retirement data from all 50 states and the District of Columbia. We’re eager to build on their work in a forthcoming piece; they’ve provided a lot to work with. One data point that stands out though, is rising contribution rates.
NCTQ researchers found that just eight states have reasonable contribution rates – which they define as a combined contribution rate of 10-15 percent of salary. Unfortunately, a significant portion of pension contributions today are going toward debt costs – not to teachers themselves (see Figure 3 here). We’ve written about this before, but the short of it is that today’s new teachers are paying for years of pension system underfunding in the form of lower benefits and stagnant salaries. State pension debts are posing risks to hiring and retaining a quality teaching workforce.
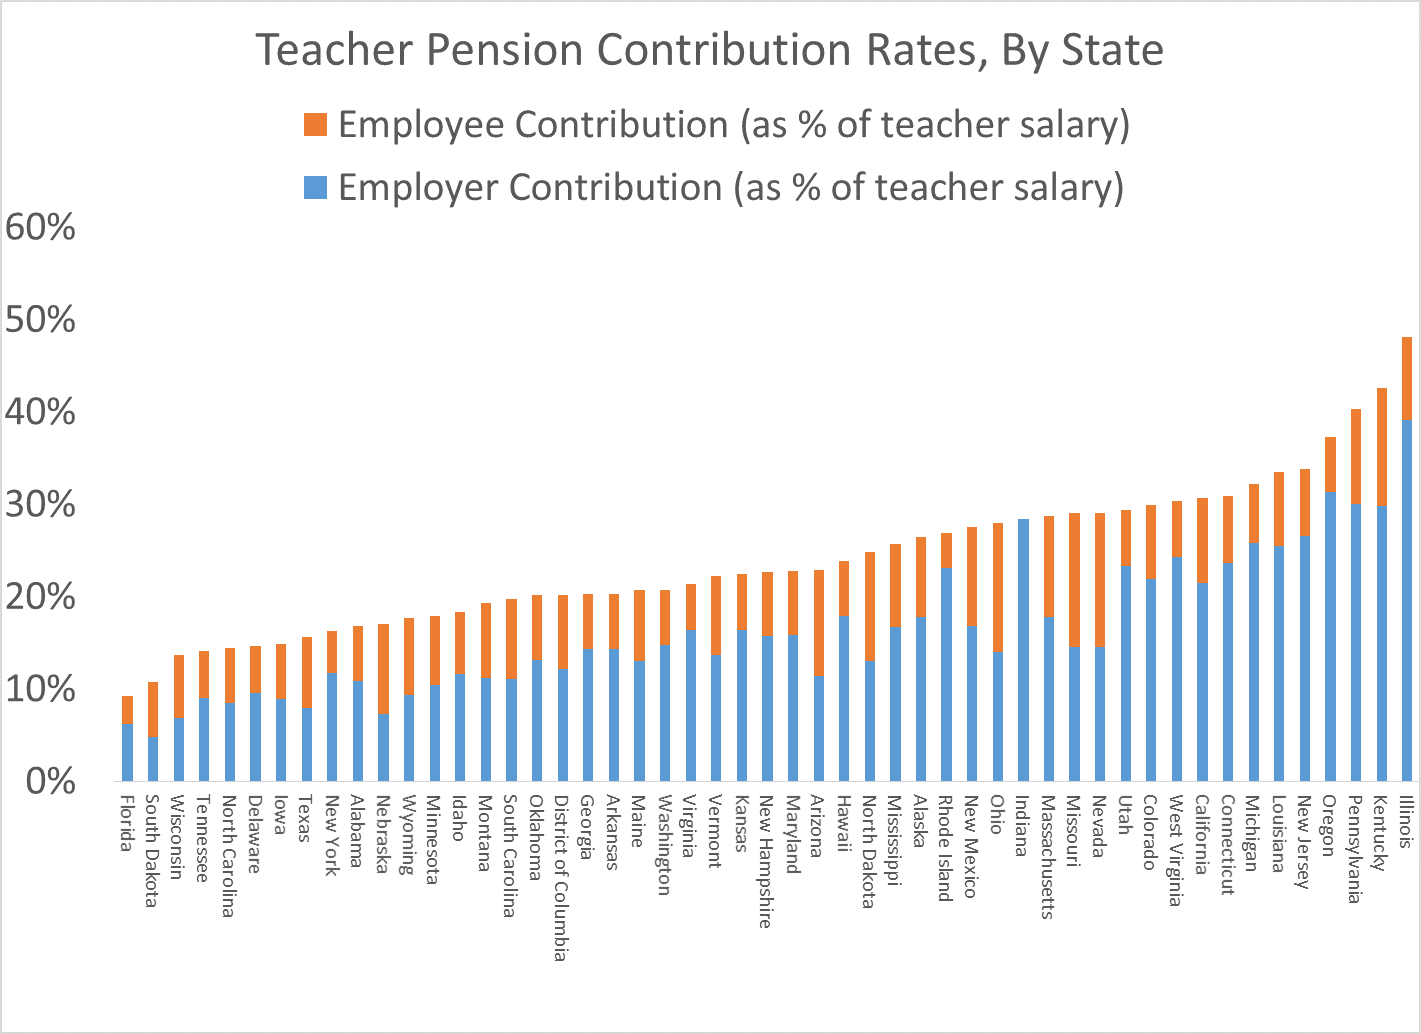
But employer contributions are just one part of the plan. The graph below shows total teacher pension contribution rates (the table at the bottom of the post has the same data in text format). The blue bars represent the employer contribution (which can come from the state, a district, or both), and the orange bars represent the employee’s share.
As the graph shows, the total contribution rates are daunting. The average is now 24 percent, and states like Pennsylvania, Kentucky, and Illinois are all contributing over 40 percent of a teacher’s salary into their state retirement system. Other states are heading in that direction.
Both teacher and employer contributions have been trending upward. Since 2008, 30 states have increased teacher contributions. In 1982, only 13 state plans had employee contribution rates of 7 percent or above. Today, 29 do.
When teachers are asked to pay higher contributions for the same benefits, that makes it even less likely that they’ll earn pensions worth more than their own contributions plus interest. That hurts new and future teachers the most. Rising contribution rates do not significantly impact teachers who were already members of the retirement system – often, they’ve already worked most of their careers under the plan’s earlier, lower employee contribution rates. It’s the newest hires who take the brunt of a higher employee contribution, all while paying off the debt costs of a plan they are statistically unlikely to benefit from.
State | Employer Contribution* (as % of salary) | Employee Contribution (as % of salary) | Total Contribution (as % of salary) |
Alabama | 10.82% | 6.00% | 16.82% |
Alaska | 17.78% | 8.65% | 26.43% |
Arizona | 11.34% | 11.50% | 22.84% |
Arkansas | 14.30% | 6.00% | 20.30% |
California | 21.41% | 9.21% | 30.62% |
Colorado | 21.94% | 8.00% | 29.94% |
Connecticut | 23.65% | 7.25% | 30.90% |
Delaware | 9.58% | 5.00% | 14.58% |
District of Columbia | 12.17% | 8.00% | 20.17% |
Florida | 6.21% | 3.00% | 9.21% |
Georgia | 14.27% | 6.00% | 20.27% |
Hawaii | 17.89% | 6.00% | 23.89% |
Idaho | 11.57% | 6.79% | 18.36% |
Illinois | 39.12% | 9.00% | 48.12% |
Indiana | 28.41% | 0.00% | 28.41% |
Iowa | 8.93% | 5.95% | 14.88% |
Kansas | 16.38% | 6.00% | 22.38% |
Kentucky | 29.755% | 12.86% | 42.61% |
Louisiana | 25.51% | 8.00% | 33.51% |
Maine | 13.01% | 7.65% | 20.66% |
Maryland | 15.79% | 7.00% | 22.79% |
Massachusetts | 17.73% | 11.00% | 28.73% |
Michigan | 25.78% | 6.40% | 32.18% |
Minnesota | 10.37% | 7.50% | 17.87% |
Mississippi | 16.65% | 9.00% | 25.65% |
Missouri | 14.50% | 14.50% | 29.00% |
Montana | 11.16% | 8.15% | 19.31% |
Nebraska | 7.25% | 9.78% | 17.03% |
Nevada | 14.50% | 14.50% | 29.00% |
New Hampshire | 15.67% | 7.00% | 22.67% |
New Jersey | 26.55% | 7.20% | 33.75% |
New Mexico | 16.78% | 10.70% | 27.48% |
New York | 11.72% | 4.50% | 16.22% |
North Carolina | 8.47% | 6.00% | 14.47% |
North Dakota | 13.04% | 11.75% | 24.79% |
Ohio | 14.00% | 14.00% | 28.00% |
Oklahoma | 13.11% | 7.00% | 20.11% |
Oregon | 31.26% | 6.00% | 37.26% |
Pennsylvania | 30.03% | 10.30% | 40.33% |
Rhode Island | 23.13% | 3.75% | 26.88% |
South Carolina | 11.09% | 8.66% | 19.75% |
South Dakota | 4.74% | 6.00% | 10.74% |
Tennessee | 9.04% | 5.00% | 14.04% |
Texas | 7.92% | 7.70% | 15.62% |
Utah | 23.31% | 6.00% | 29.31% |
Vermont | 13.63% | 8.53% | 22.16% |
Virginia | 16.32% | 5.00% | 21.32% |
Washington | 14.78% | 5.95% | 20.73% |
West Virginia | 24.32% | 6.00% | 30.32% |
Wisconsin | 6.85% | 6.80% | 13.65% |
Wyoming | 9.38% | 8.25% | 17.63% |
* For consistency, we use NCTQ’s data and definition here -- these rates are actuarially–required contributions (ARC), which may differ from what employers do in fact contribute. Several states also have legacy costs associated with closed pension plans: Alaska, Indiana, Oregon, Utah, and Washington. These states are paying down debts associated with inactive plans. Finally, Michigan and Nevada did not report the normal costs in their most recent valuation reports. For these states, NCTQ uses the same rates that were reported for 2014.