Last week I presented our new paper, Friends without Benefits: How States Systematically Shortchange Teachers' Retirement and Threaten Their Retirement Security, at the 39th annual conference of the Association of Education Finance and Policy (AEFP). For those of you who couldn't make it, I've pasted my slides below and added a bit of explanatory commentary.
Economists like Bob Costrell and Mike Podgursky have been drawing pension wealth accrual curves for several years now. In one chart, they tell the compelling story of the back-loaded nature of defined beenfit pension plans.
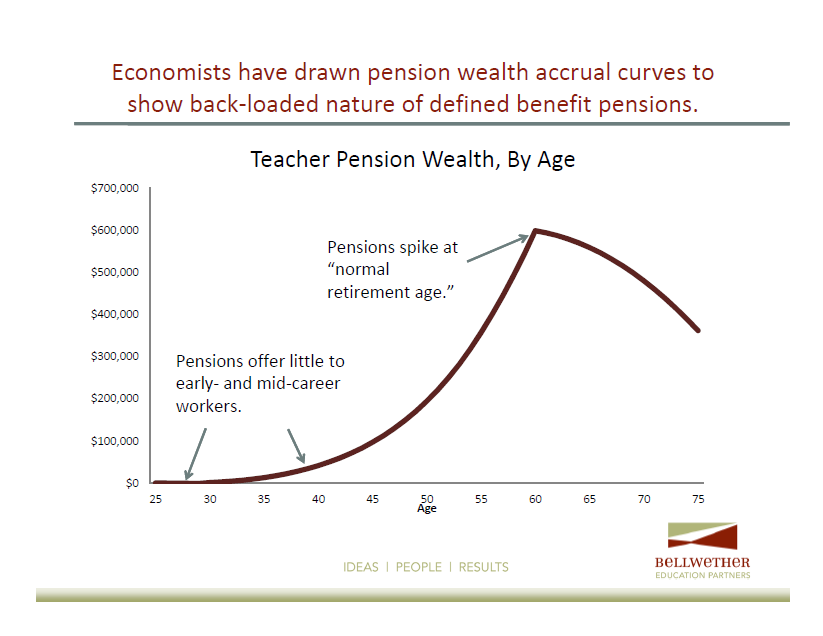
Unfortunately, the pension wealth accrual curves don't tell us much about how many people make it to each stage. If the vast majority of workers remained in one pension plan for the life of their career, the back-loaded nature of defined benefits would create some perverse incentives around the normal retirement age (where pension wealth comes to a steep spike), but it wouldn't matter that the employee was accumulating very little early in their career.
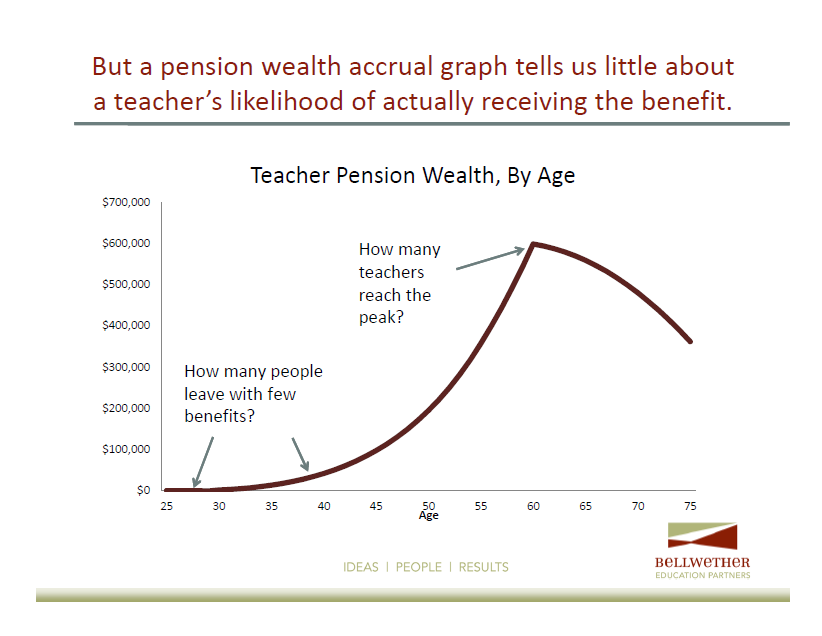
We set out to answer the question of how many teachers reach various career stages. Nationally, there's solid research evidence that slightly under half of all new teachers stick around for at least five years, but there hasn't been a good source of state data. But pension plans have this information. Pension plans need to estimate how many people will remain in the pension plan and for how long in order to estimate how much future benefits will cost. These estimates can be converted into teacher retention rates.

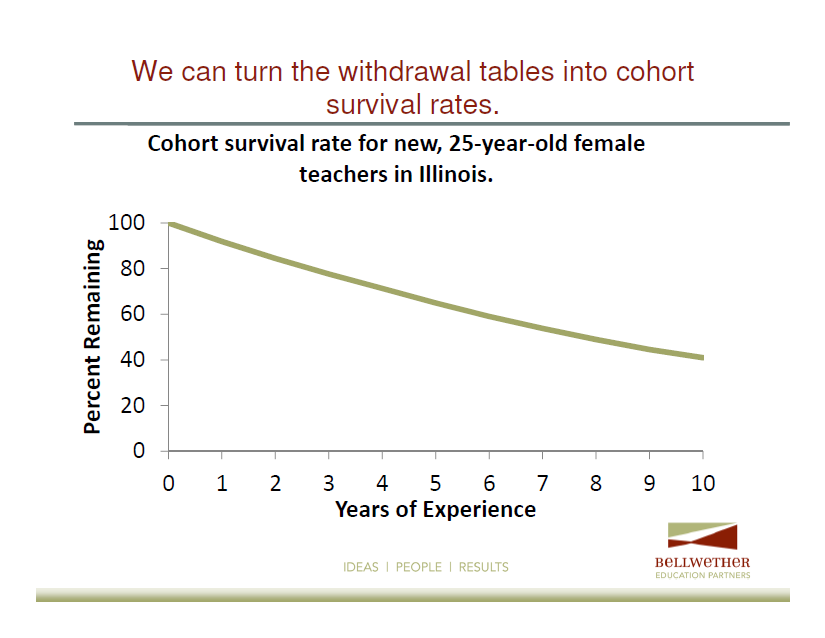
All states publish "withdrawal" assumptions estimating what percentage of teachers will leave in a given year. They publish separate rates based on gender, age, and years of experience, but years of experience is often the dominant factor.
We collected these tables for every state and used them to calculate teacher retention rates.

We used each states' own estimates to calculate teacher retention rates across an entire working career. In our paper we focused on new 25-year-old female teachers, but we could have run similar calculations for 47 year-old-males, for example.
We compared the retention (aka cohort survival) rates in each state with various career milestones. In particular, we were interested in the percentage of teachers who remained long enough to "vest" into the state pension system and thereby qualify for at least a minimal pension benefit, and the percentage who remained in teaching for an entire career.

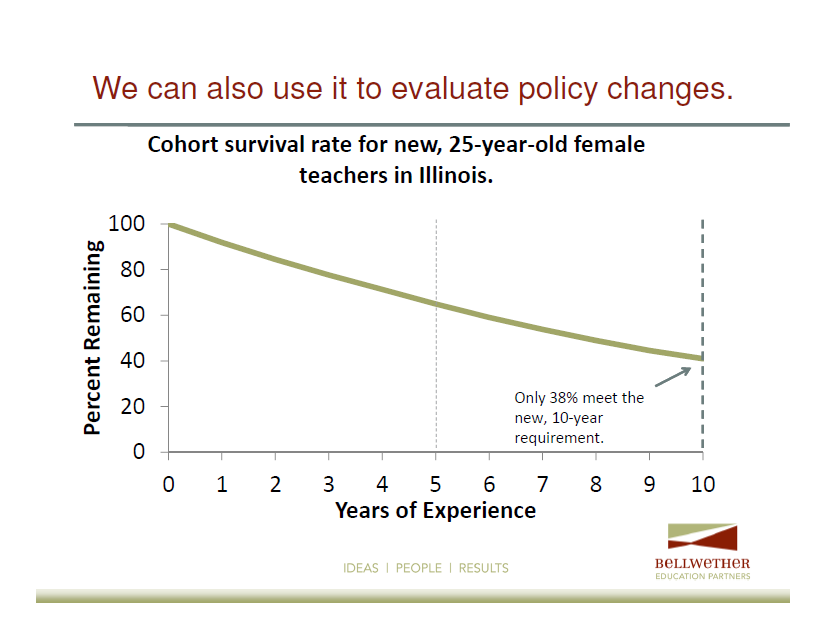
We can use these calculations to evaluate policy changes. When Illinois lengthened its vesting period from five years to ten, for example, it made it harder for teachers to qualify for a minimal pension benefit. Using the states' own figures, we estimate that only about 38 percent of teachers will remain as teachers in Illinois long enough to qualify for the new, ten-year vesting period. 62 percent of new Illinois teachers won't earn a pension from their pension system.
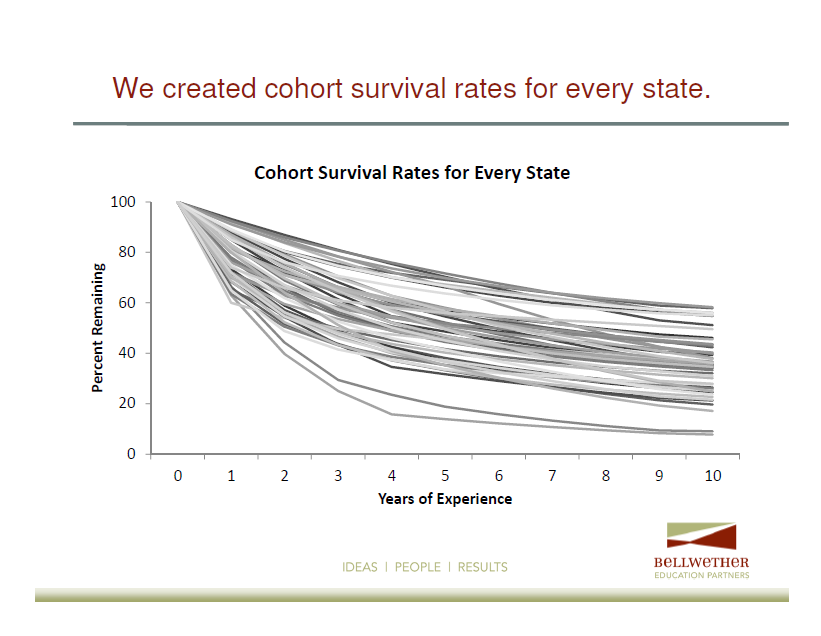
We can run these calculations for every state. The graph below shows what the 10-year retention rates look like according to each state's pension plan. The graph below isn't fine-grained enough to show the results for each state, but it does show that some states have much steeper teacher turnover rates than others.
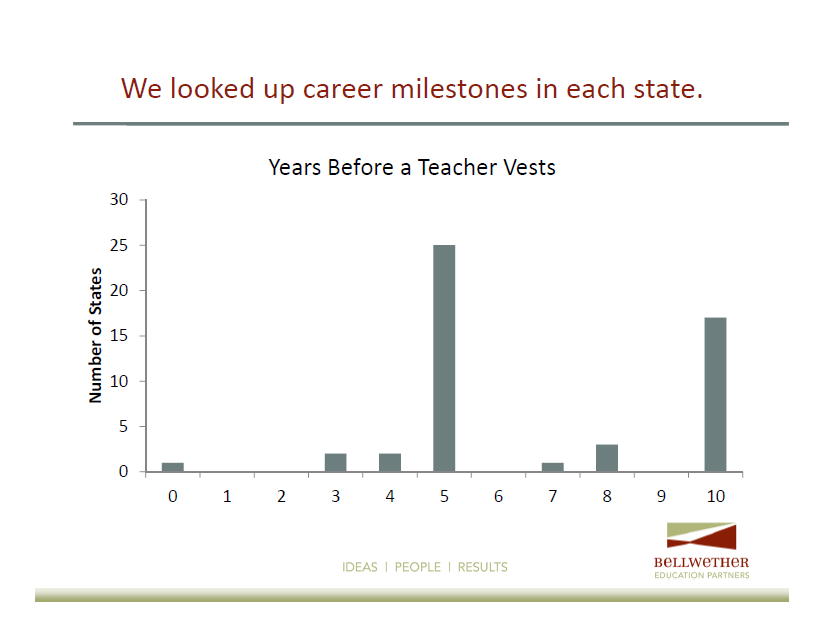
Next, we compared the teacher retention estimated with career milestones in each state. For example, 24 states and the District of Columbia have 5-year vesting requirements, while another 17 states have 10-year vesting periods. These numbers are rising and moving to the right of the graph; during the recent recession, 12 states made it more difficult for teachers to qualify for a pension by raising their vesting requirement.
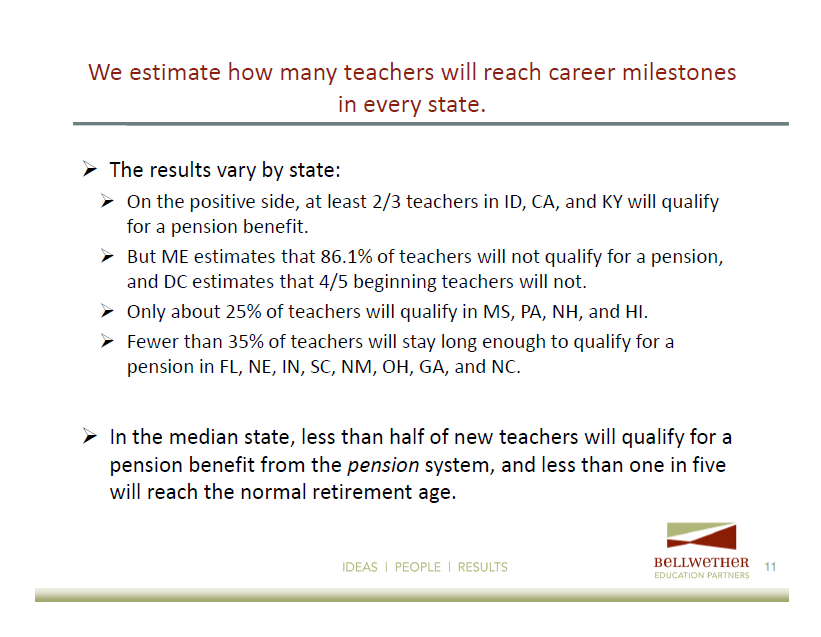
While the numbers vary by state, in the median state, less than half of all new teachers will not remain long enough to qualify for a pension. If we look at a longer time horizon, less than one in five new, 25-year-old teachers will remain as teachers for a full career and reach the state's normal retirement age.
Our estimates do not include the possibility of death, disability, and retirement. Those factors would all increase teacher turnover rates, meaning our estimates, particularly those for the percentage of teachers reaching later milestones, are likely on the low end.
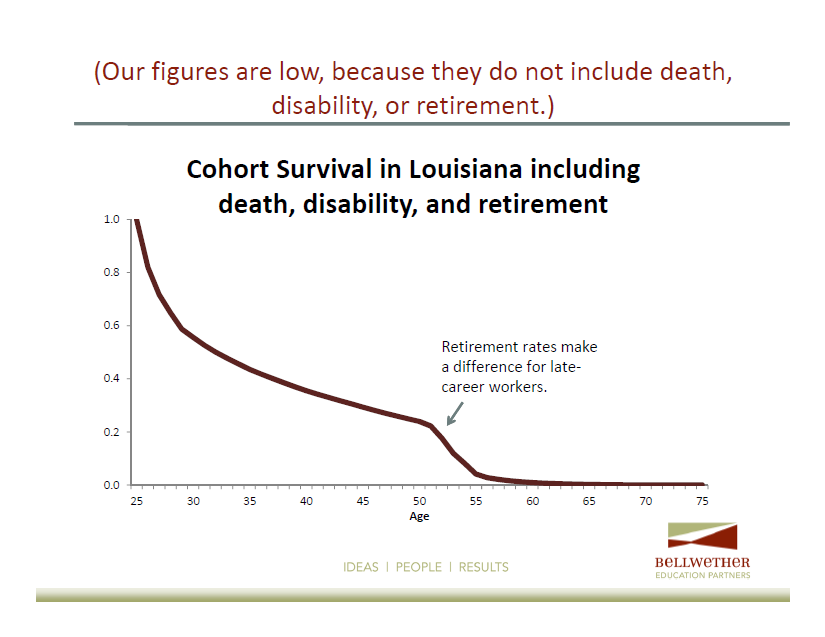
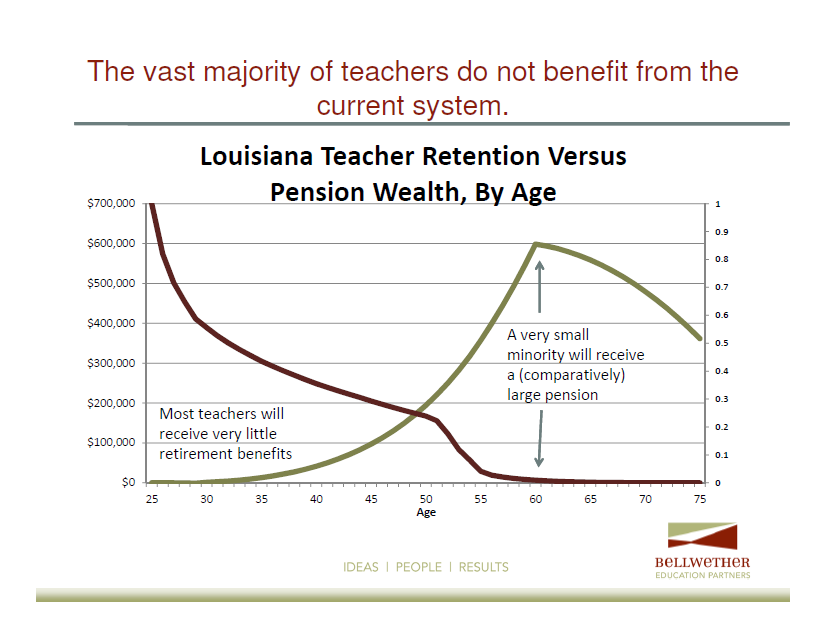
We can combine the pension wealth accrual curves discussed above with the estimated teacher retention rates. The graph below is from Louisiana. It shows that only a small fraction of teachers will remain long enough to qualify for the more generous benefits at the back-end of a teacher's career.
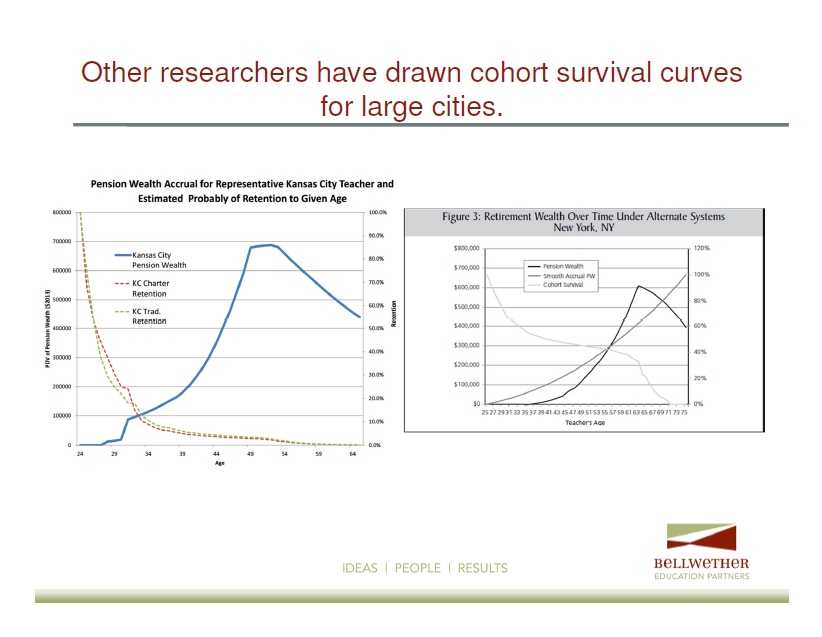
We aren't the first to do this type of work. Other researchers have drawn similar graphs for the 10 largest cities and for urban teachers in Missouri. They tell a similar story. But, our paper is the first to attempt to calculate these rates for every state.
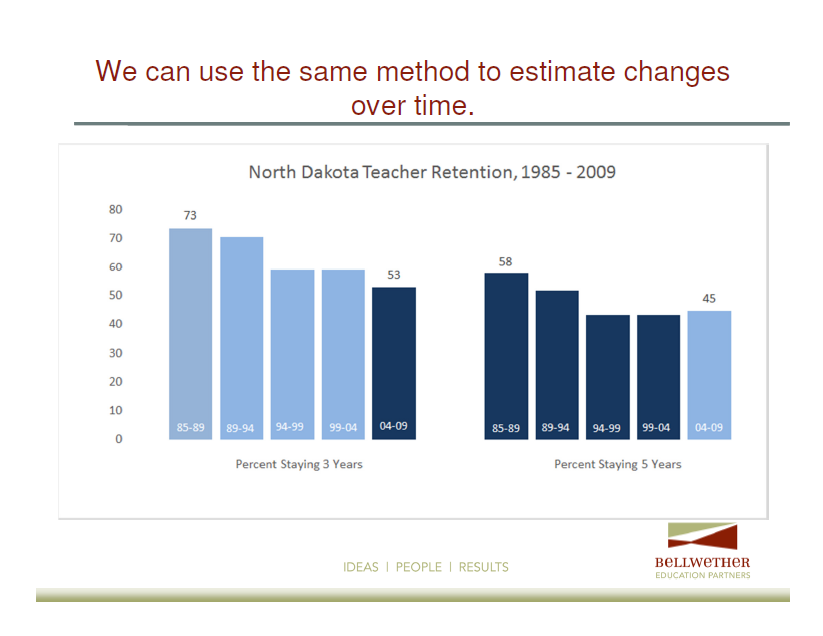
While not in our paper, here at teacherpensions.org we've used a similar methodology to study other issues. For example, in the chart below we used 25 years of data from the North Dakota teacher pension system to show how falling teacher retention rates have led to fewer teachers qualifying for a pension. North Dakota also raised its vesting period from three years to five, making it even more difficult. We estimate that, while 73 percent of North Dakota teachers qualified for a pension in the late 1980s, now only 45 percent of teachers do.
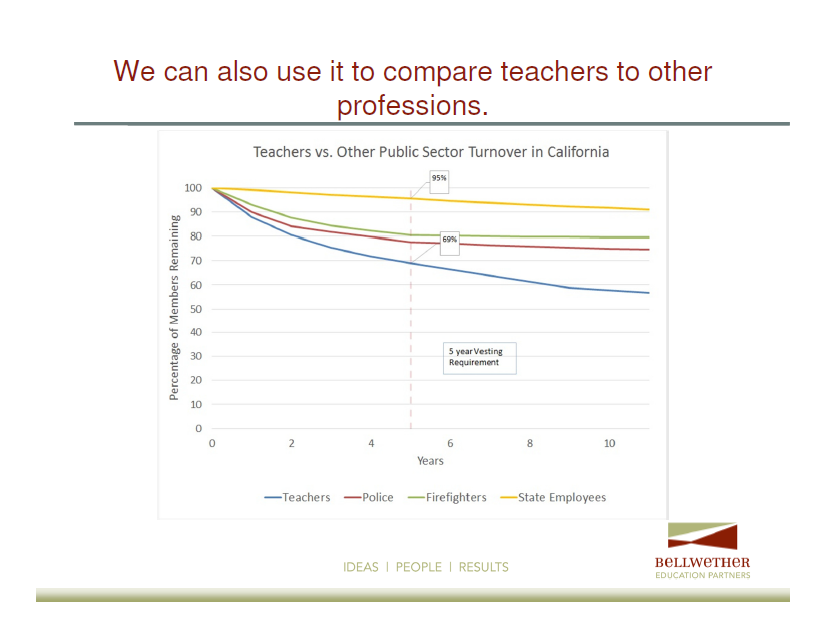
We can also use the same method to compare teacher turnover with turnover rates in other professions. The graph below compares California teachers with California police officers, firefighters, and state employees. It shows that teachers have much steeper turnover rates in California than these other professions, which suggests that the back-loaded defined pension structure is less suitable to teachers than other public sector workers.
If you've read this far, we hope you keep coming back for more information on teacher pensions as we continue to write and blog about the issue.