What does the "average" retired state or local government worker receive in pension benefits? The map below comes from the U.S. Census Bureau, and it shows the statistical mean pension benefit in each state. As the map suggests, average pension benefits tend to be highest in the Northeast and in Ohio, Illinois, Colorado, Nevada, and California. Benefits tend to be more modest in the Bible Belt and the Northern Rockies States of the Dakotas, Montana, Wyoming, and Idaho.
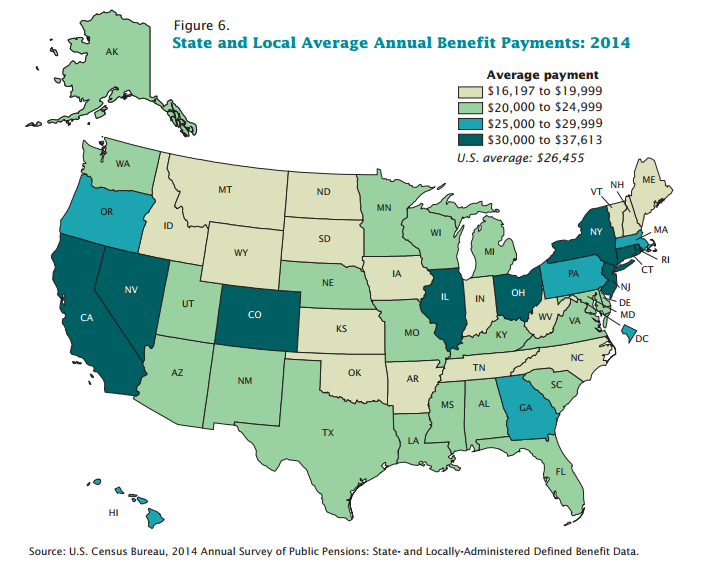
There are a few caveats to note about this map:
1. These figures are not adjusted based on cost of living. Although average pensions may be similar in Georgia and the District of Columbia, for example, these two places have different costs of living.
2. The figures do not factor in Social Security. Sticking with Georgia as an example, it does not offer all of its public-sector workers Social Security--its neighbors all do--so Georgia must offer more generous pension plans than neighboring states.
3. The pension figures also do not factor in the worker's own contributions. Even if workers earn the same pension amount, workers who contributed less toward those pensions will have higher net benefits.
4. Although the figures include public school teachers, they also include all other state and local government workers who qualify for public pension benefits. In our experience, retired teachers tend to earn slightly higher pensions than other types of public-sector employees, meaning the figures above under-state the average teacher pension.
5. These figures include all retirees earning a public-sector pension regardless of when they retired. For a variety of reasons--such as pension benefit enhancements states have enacted over time, salary increases that boost pension formulas, and cost-of-living-adjustments that don't keep up with inflation--the pensions of those who recently retired tend to be higher than those who retired years ago.
6. Perhaps most importantly, "averages" hide a lot of nuance. Our work suggests that about half of all new teachers won't stay long enough to qualify for a pension. Although these are public-sector workers, they won't show up in the pension benefit figues, because they won't have a pension at all. But even beyond that, the averages are distored by outliers on both ends of the spectrum. Lots of workers qualify for relatively small pensions and a small portion of workers qualify for much larger benefits. Those two extremes will artificially depress the "average" benefit. In Illinois and California, for example, the "average" pension was well below the median (middle) and mode (most common) benefit amounts.
We've been working to compile teacher-specific figures, but in the meantime, remember to dig beyond simple averages to look at the full distribution of retirement benefits. In our experience, there are significant inequities depending on when teachers start, what state and even what district they work in, whether they cross state lines, and how long they remain teaching.